- Home >
- Stock Photos >
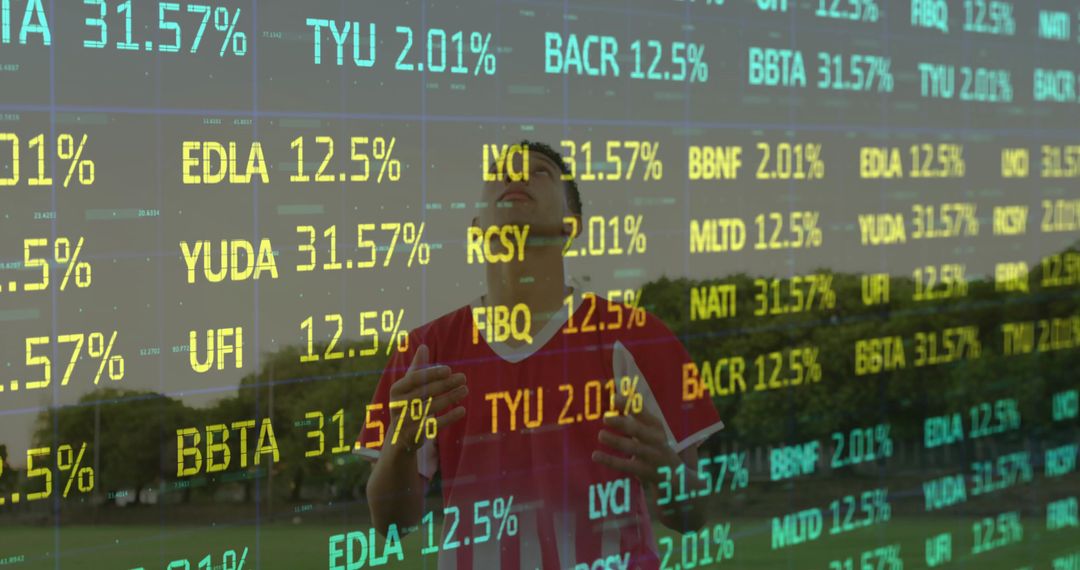
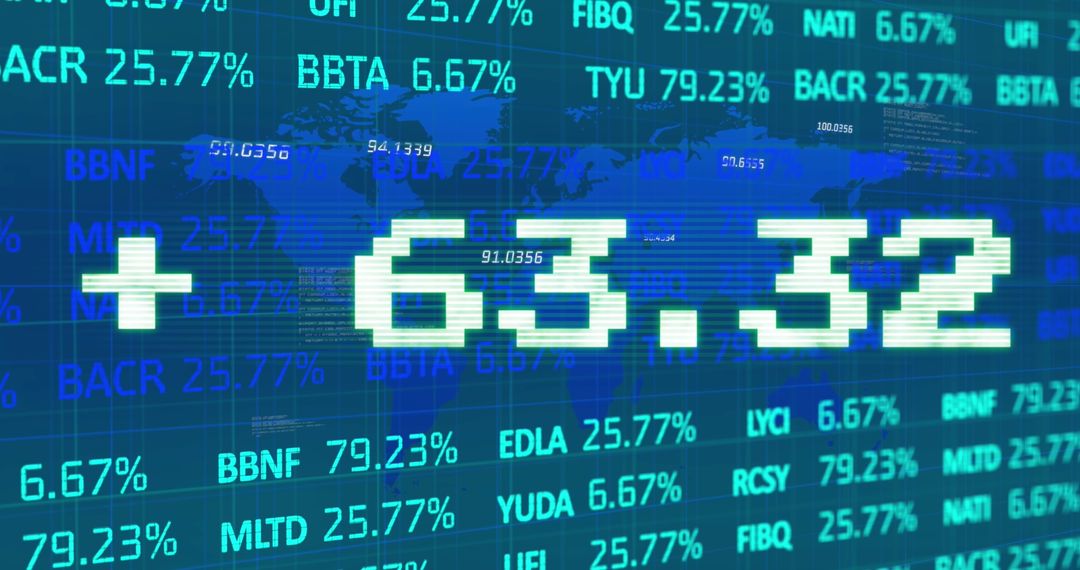
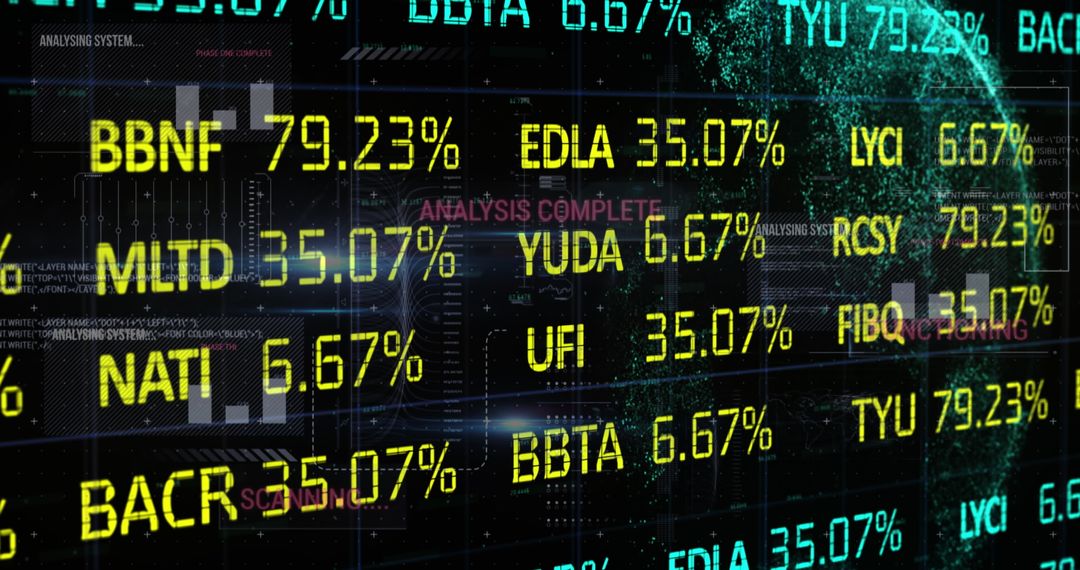
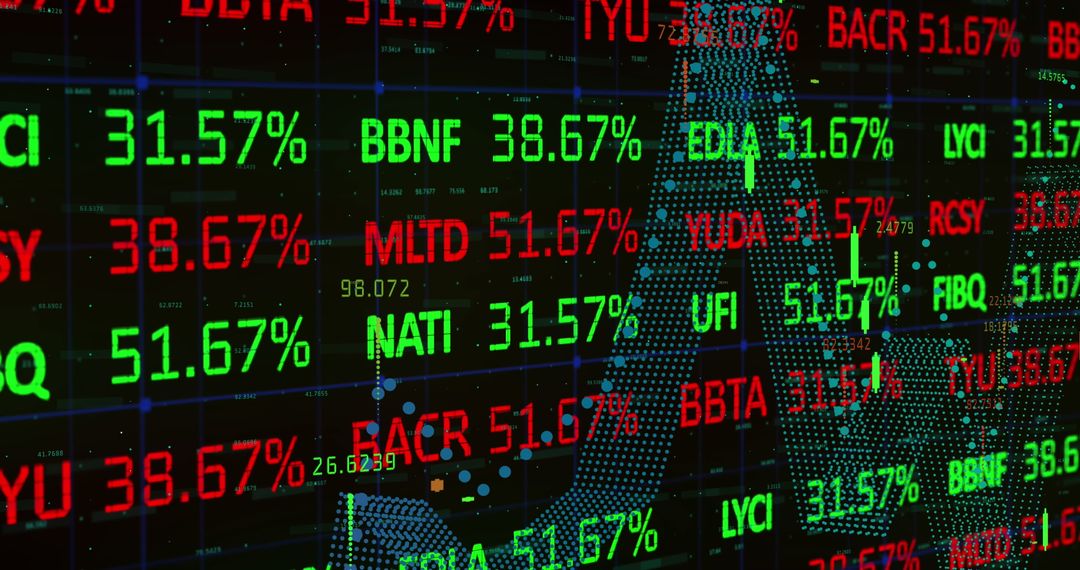
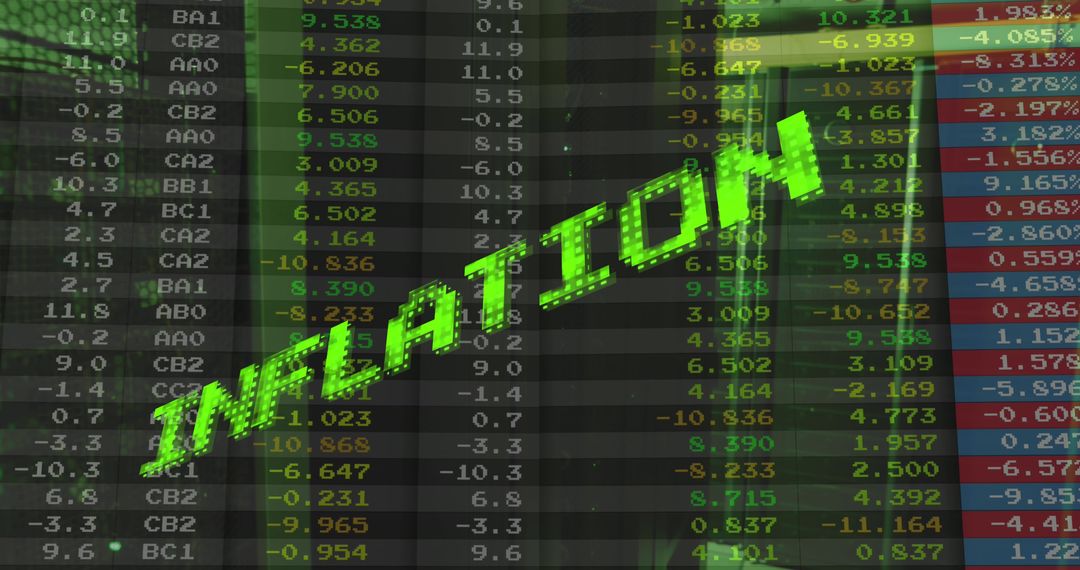
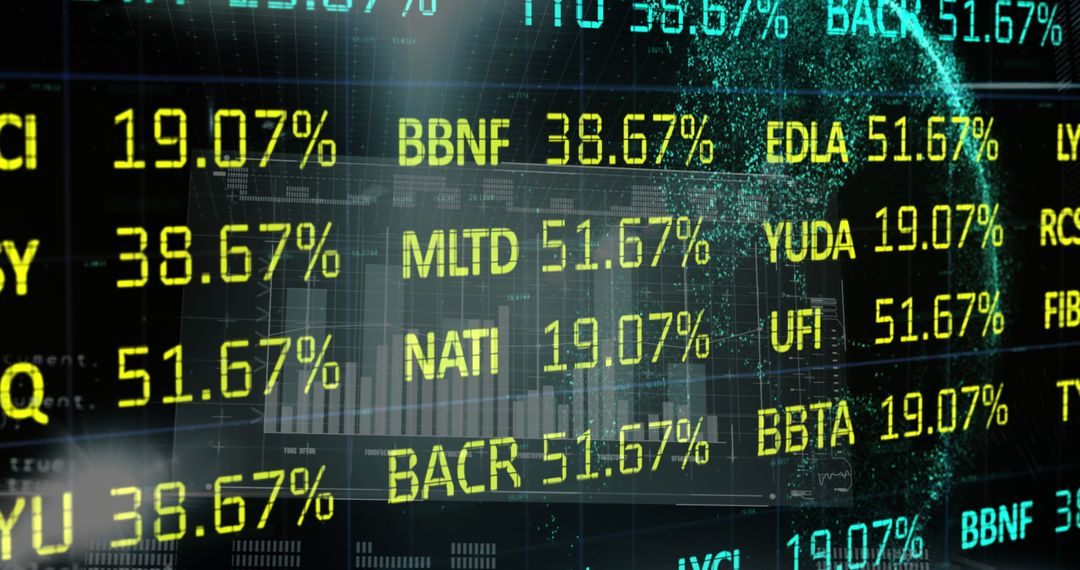
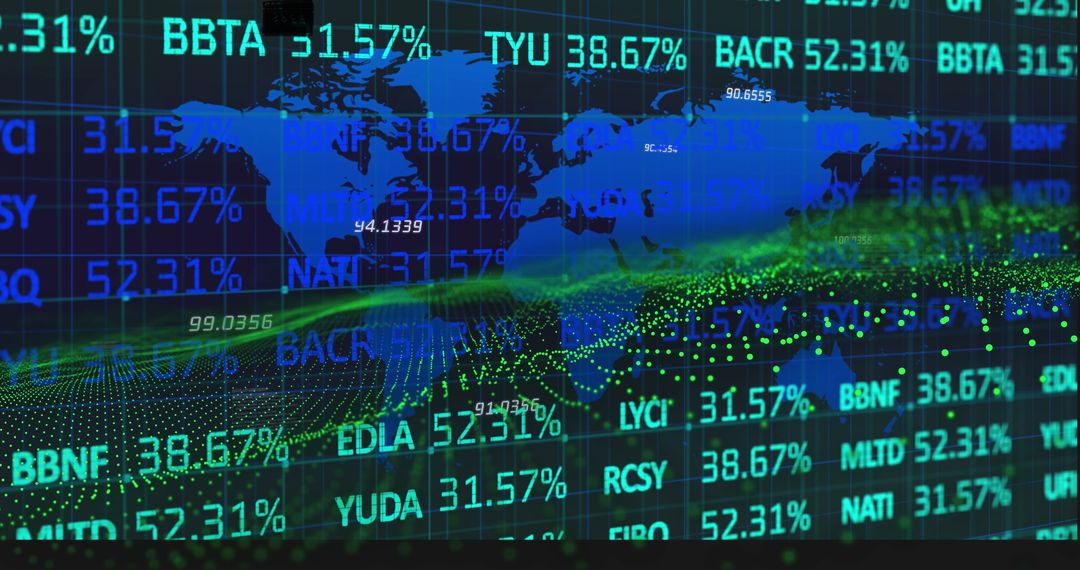
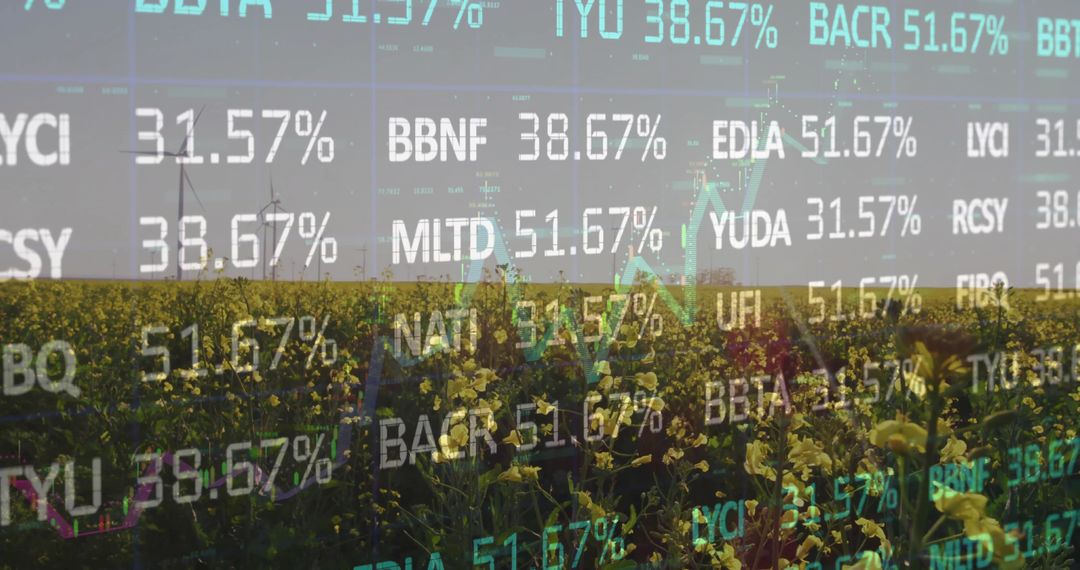
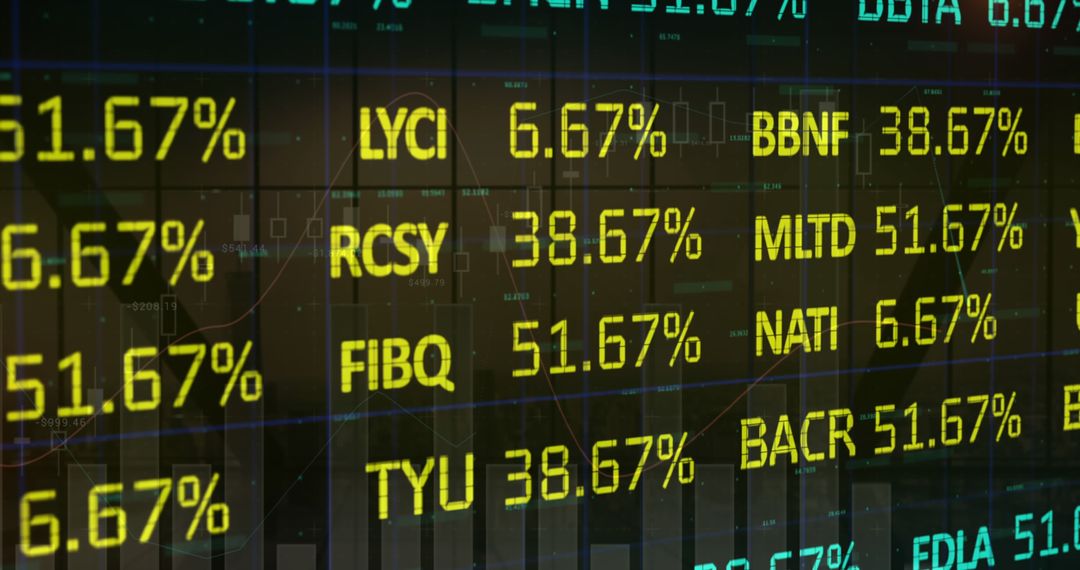
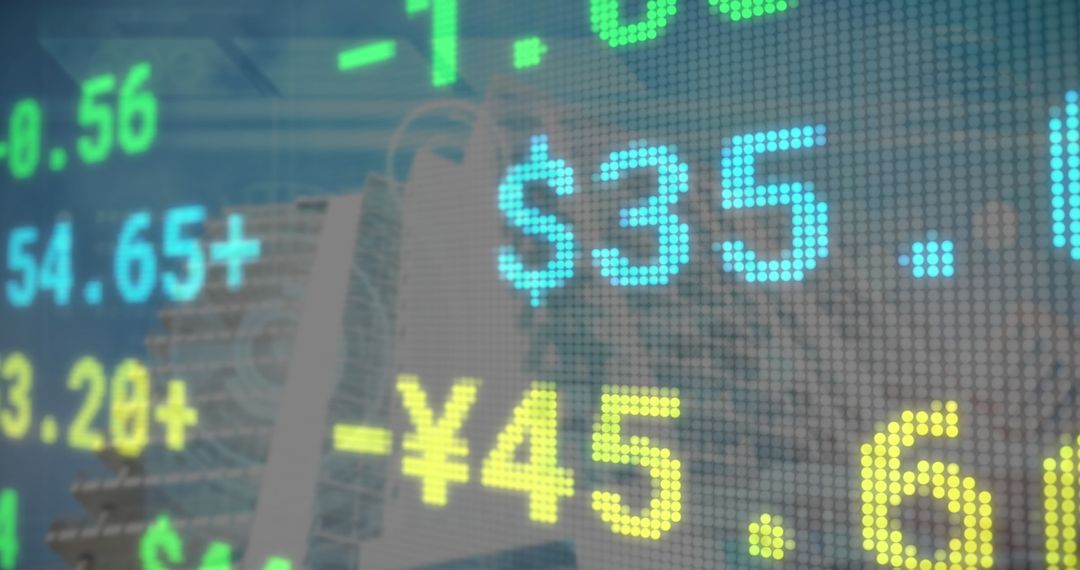
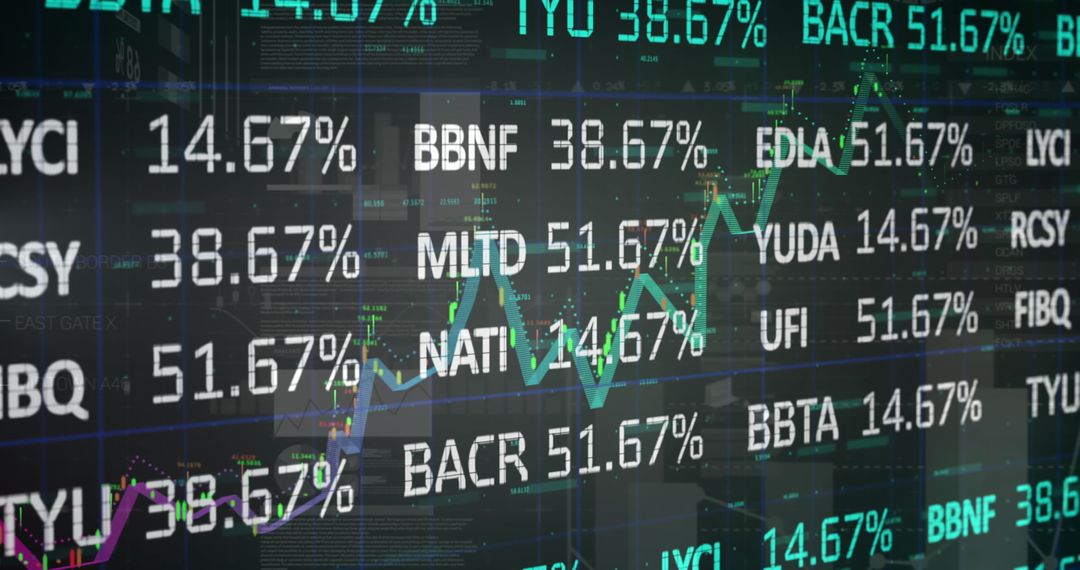
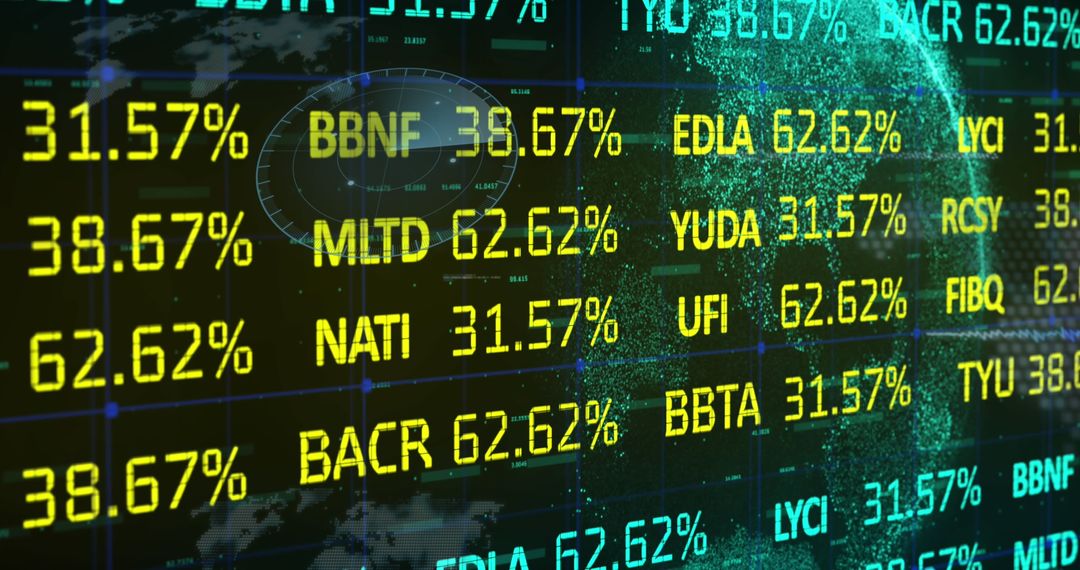
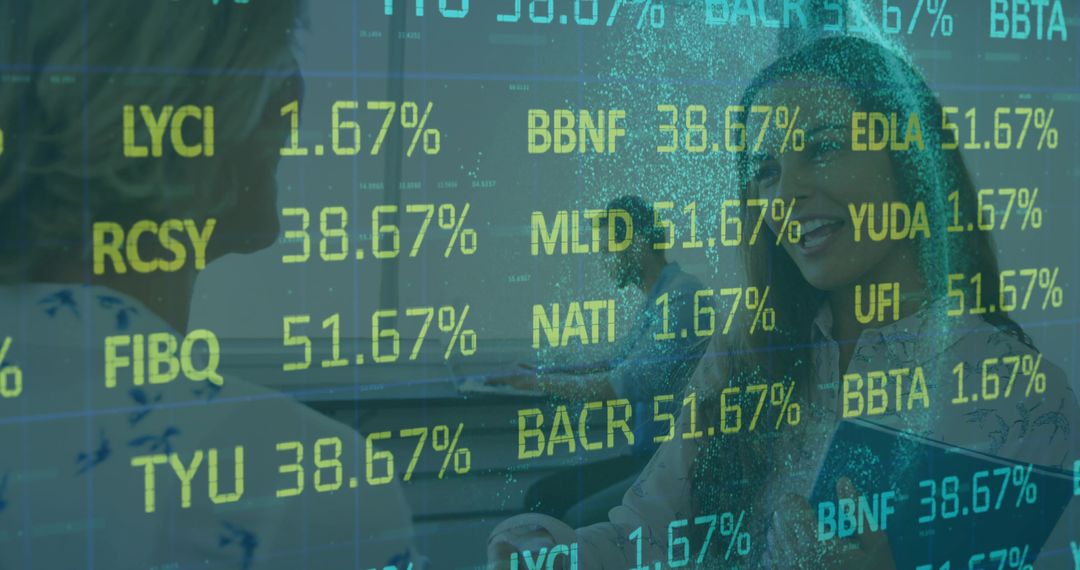
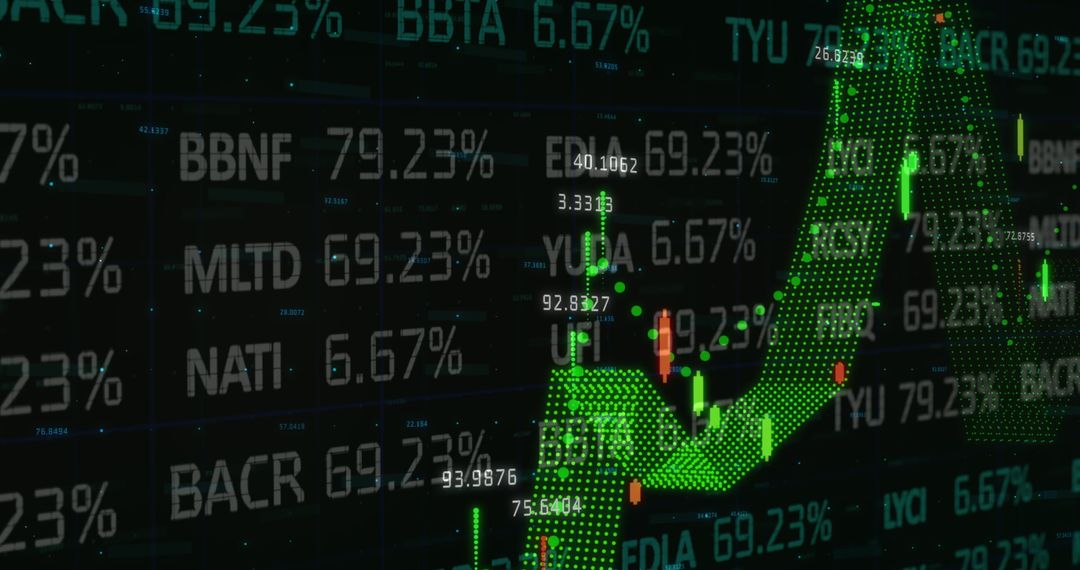
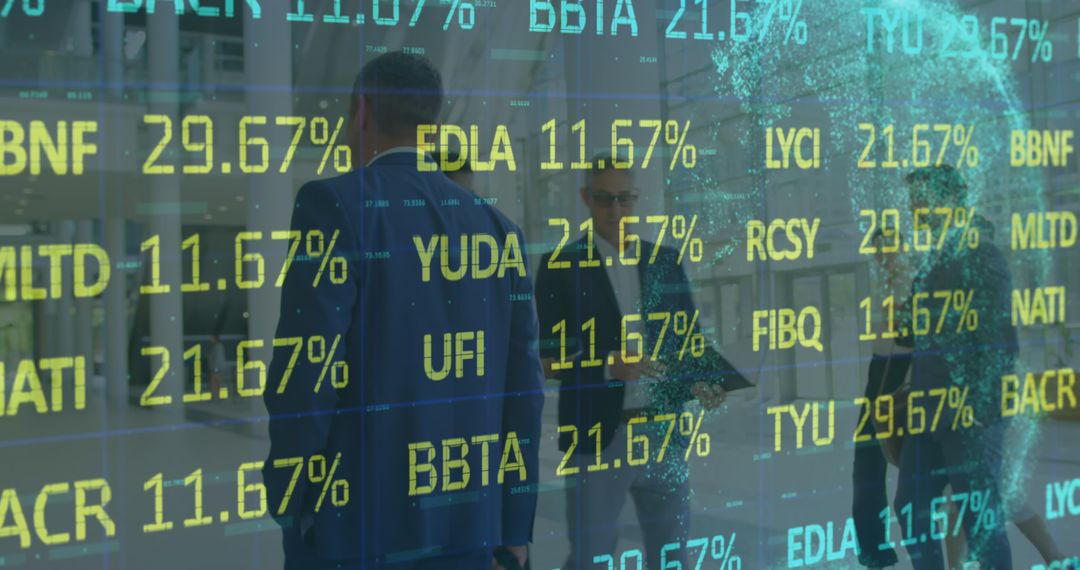
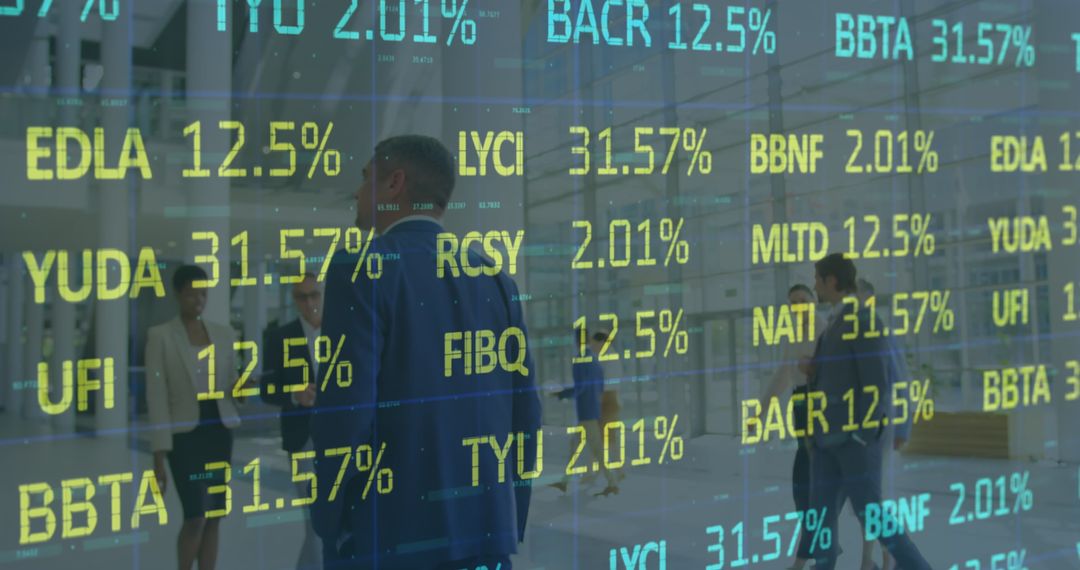
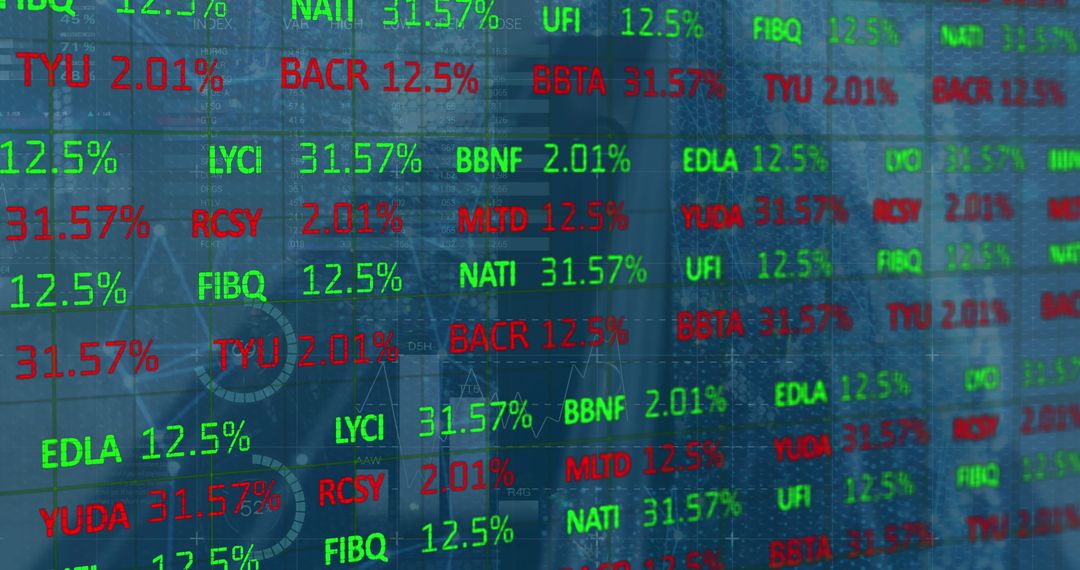
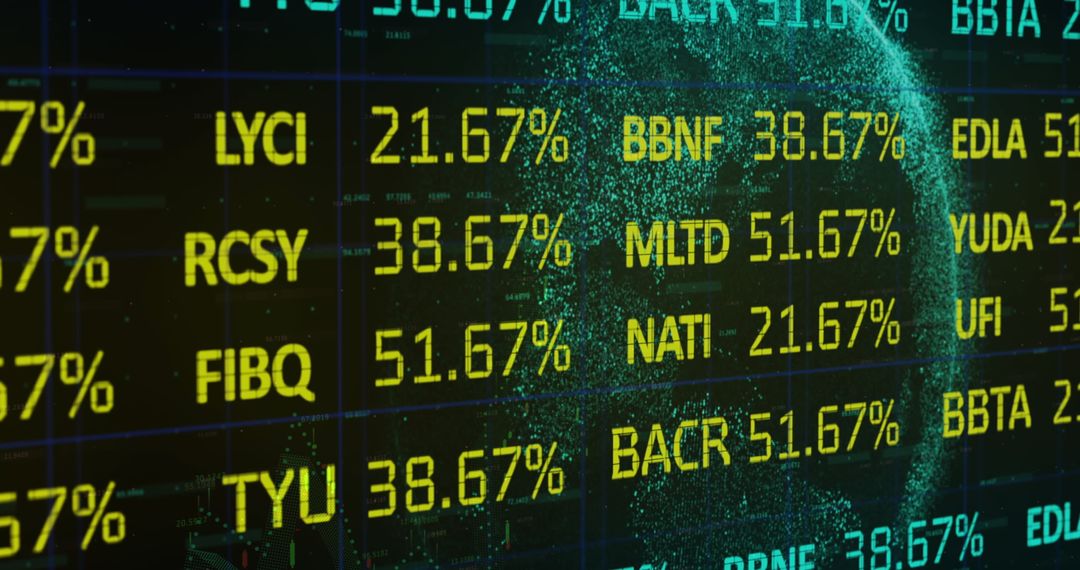
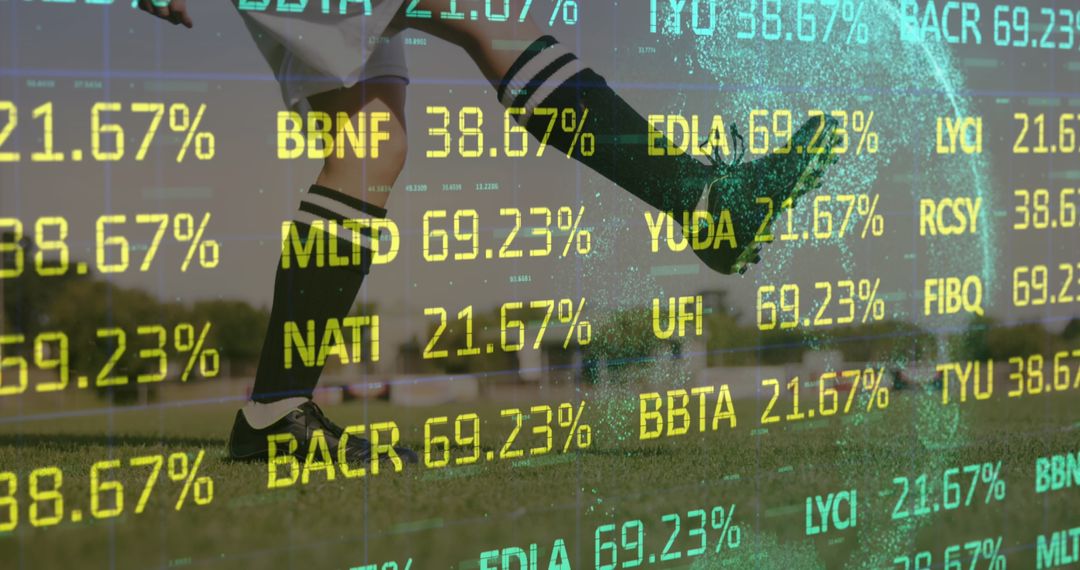
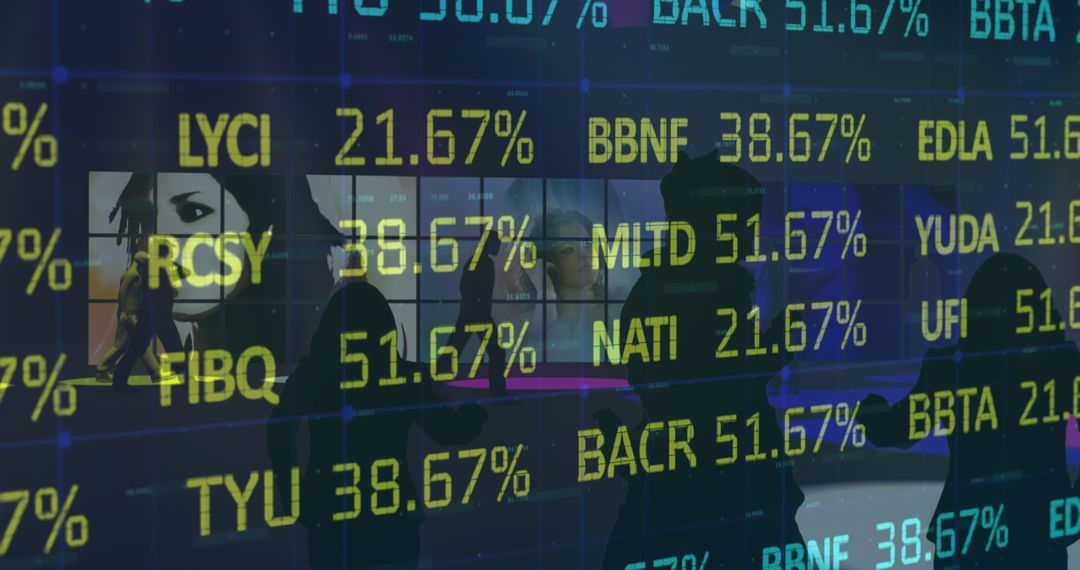
- Digital Financial Dashboard with Stock Market Percentages and Analytics
Digital Financial Dashboard with Stock Market Percentages and Analytics Image
Visual shows a digital financial dashboard highlighting stock tickers and percentages, suggesting technological integration in finance. Clear display of market data with graphs underscores analytical insights. Ideal for finance blogs, articles on modern trading systems, or tech-related finance tools.
Powered by  - Get 15% off with code: PIKWIZARD15


2
downloads
downloads
Tags:
More
Credit Photo
If you would like to credit the Photo, here are some ways you can do so
Text Link
photo Link
<span class="text-link">
<span>
<a target="_blank" href=https://pikwizard.com/photo/digital-financial-dashboard-with-stock-market-percentages-and-analytics/f7d35139b708dbda6b8e898e4ad8e160/>PikWizard</a>
</span>
</span>
<span class="image-link">
<span
style="margin: 0 0 20px 0; display: inline-block; vertical-align: middle; width: 100%;"
>
<a
target="_blank"
href="https://pikwizard.com/photo/digital-financial-dashboard-with-stock-market-percentages-and-analytics/f7d35139b708dbda6b8e898e4ad8e160/"
style="text-decoration: none; font-size: 10px; margin: 0;"
>
<img src="https://pikwizard.com/pw/medium/f7d35139b708dbda6b8e898e4ad8e160.jpg" style="margin: 0; width: 100%;" alt="" />
<p style="font-size: 12px; margin: 0;">PikWizard</p>
</a>
</span>
</span>
Free (free of charge)
Free for personal and commercial use.
Author: Authentic Images
Similar Free Stock Images

Premium


Premium


Premium


Premium


Premium


Premium


Premium


Premium


Premium


Premium


Premium


Premium


Premium


Premium


Premium


Premium


Premium


Premium


Premium


Premium


Premium


Premium


Premium


Premium