- Home >
- Stock Photos >
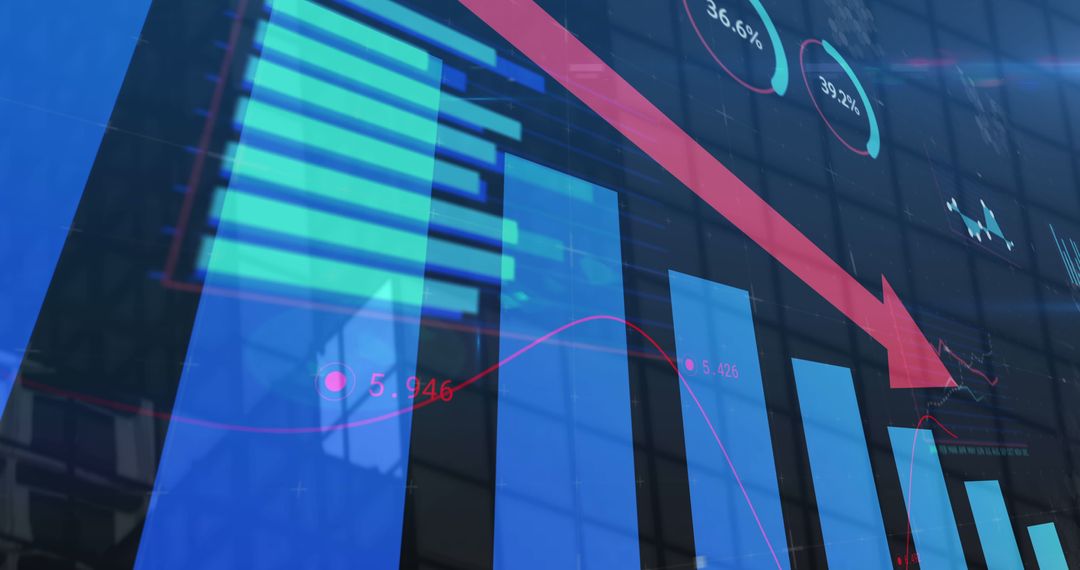
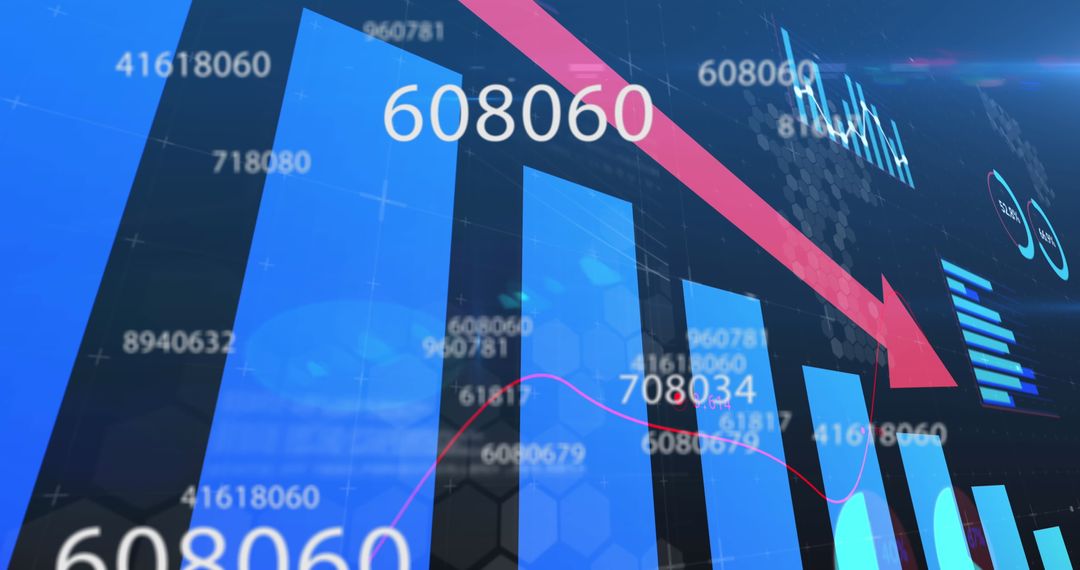
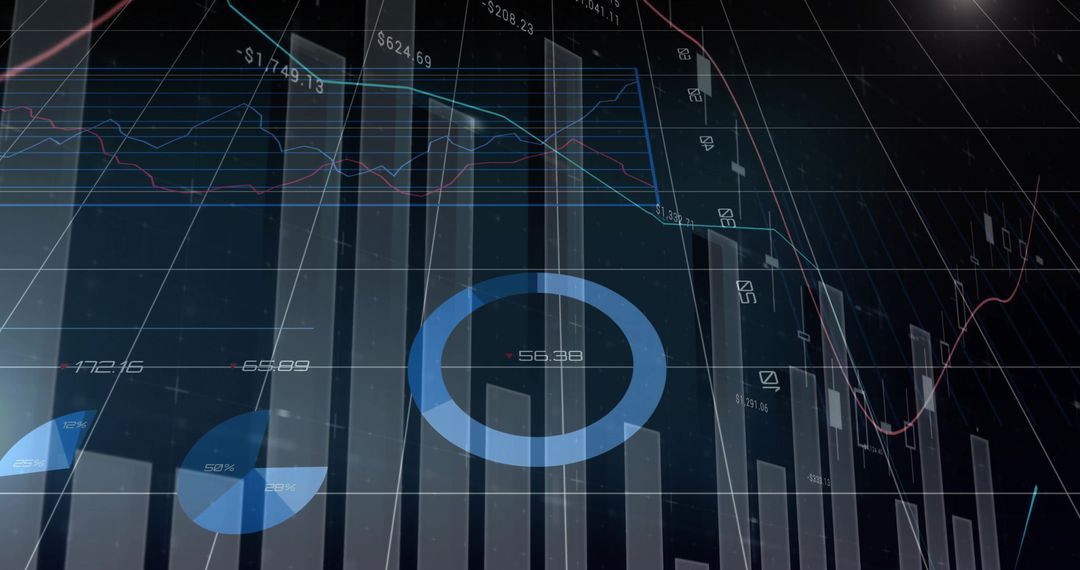
- Digital Financial Dashboard with Trend Analysis Graphs
Digital Financial Dashboard with Trend Analysis Graphs Image

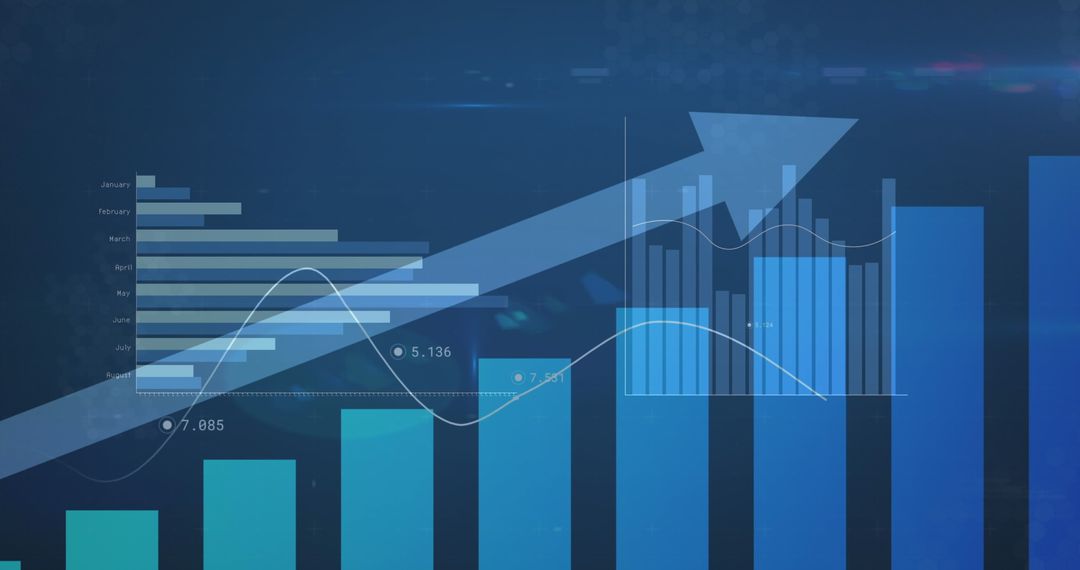
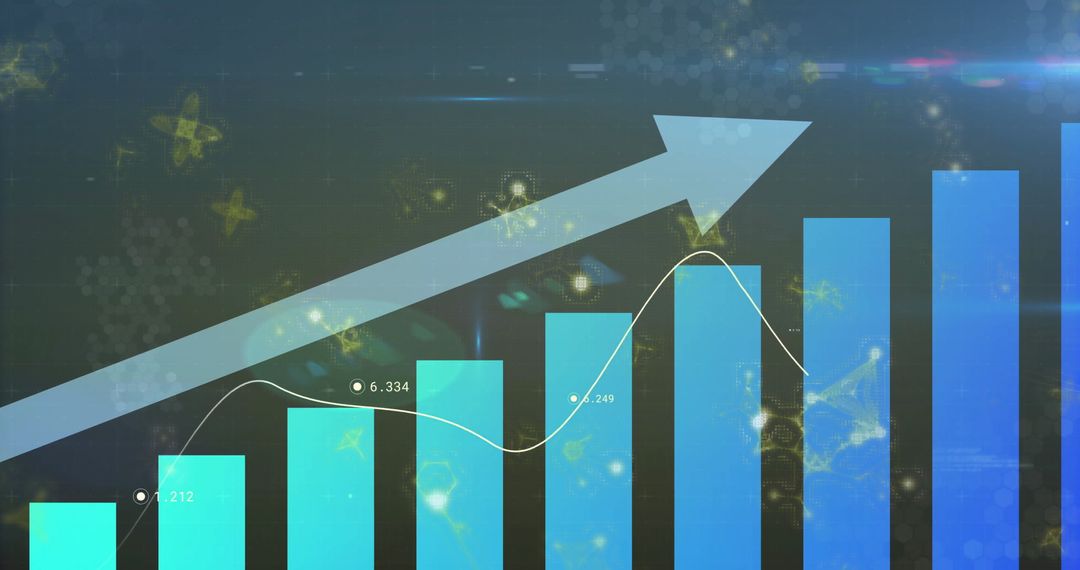
This visual showcases a futuristic financial dashboard featuring blue bar graphs and a pink trend line, all set against a digital gauge backdrop. Ideal for illustrating financial analysis, economic trends, data tracking, or in corporate presentations to enhance explanations of analytics or technology-driven business strategies. Can also be useful for technology blogs exploring advancements in data visualization.
Powered by 


0
downloads
downloads
Tags:
More
Credit Photo
If you would like to credit the Photo, here are some ways you can do so
Text Link
photo Link
<span class="text-link">
<span>
<a target="_blank" href=https://pikwizard.com/photo/digital-financial-dashboard-with-trend-analysis-graphs/0398be9c69e01b7eba06b585134b3fbc/>PikWizard</a>
</span>
</span>
<span class="image-link">
<span
style="margin: 0 0 20px 0; display: inline-block; vertical-align: middle; width: 100%;"
>
<a
target="_blank"
href="https://pikwizard.com/photo/digital-financial-dashboard-with-trend-analysis-graphs/0398be9c69e01b7eba06b585134b3fbc/"
style="text-decoration: none; font-size: 10px; margin: 0;"
>
<img src="https://pikwizard.com/pw/medium/0398be9c69e01b7eba06b585134b3fbc.jpg" style="margin: 0; width: 100%;" alt="" />
<p style="font-size: 12px; margin: 0;">PikWizard</p>
</a>
</span>
</span>
Free (free of charge)
Free for personal and commercial use.
Author: Awesome Content
Similar Free Stock Images

Premium


Premium


Premium


Premium


Premium


Premium


Premium


Premium


Premium


Premium


Premium


Premium


Premium


Premium


Premium


Premium


Premium


Premium


Premium


Premium


Premium


Premium


Premium


Premium