- Home >
- Stock Photos >
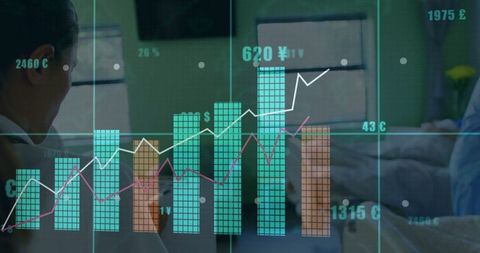
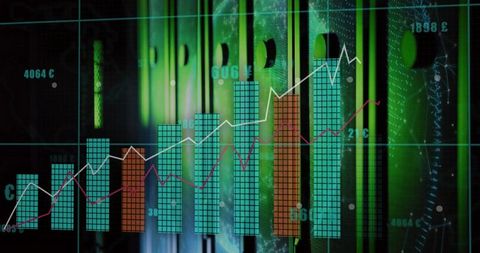
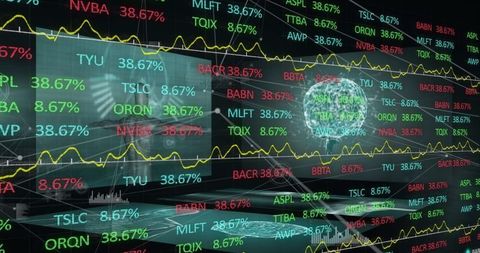
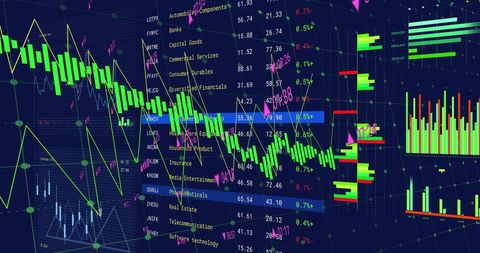
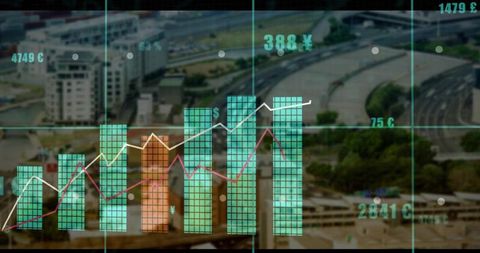
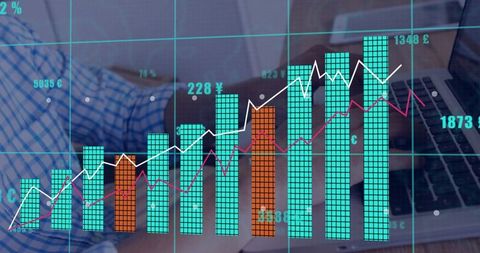
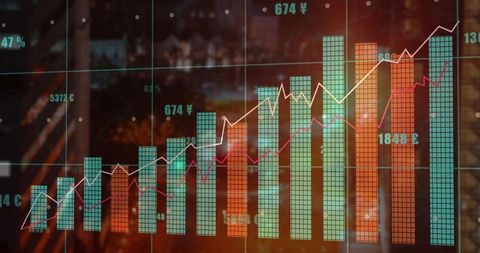
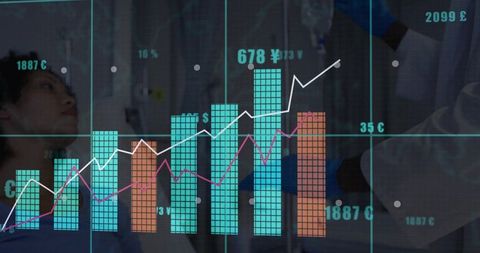
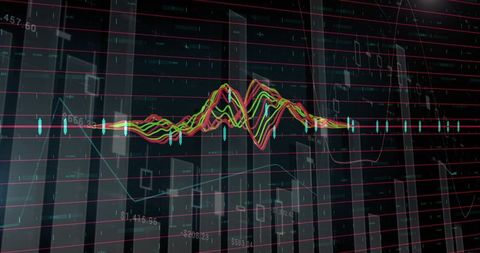
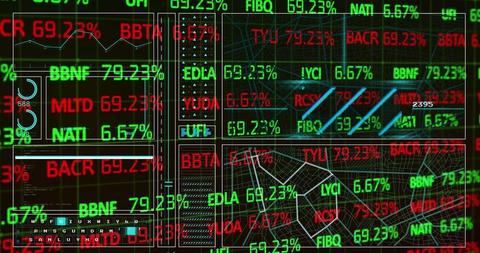
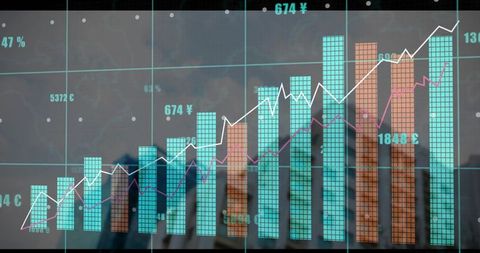
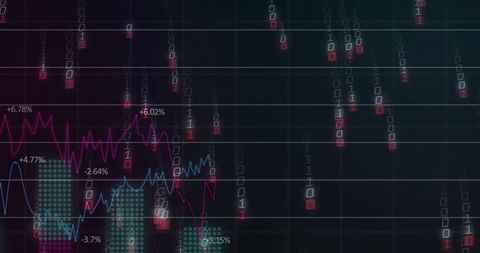
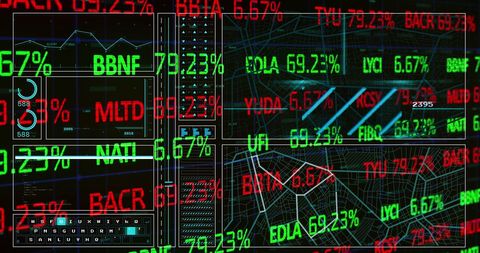
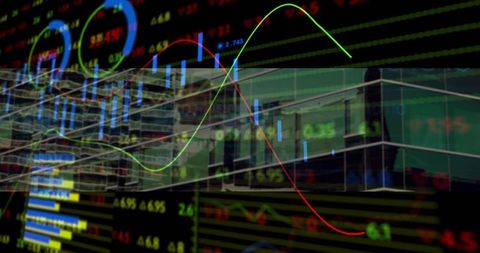
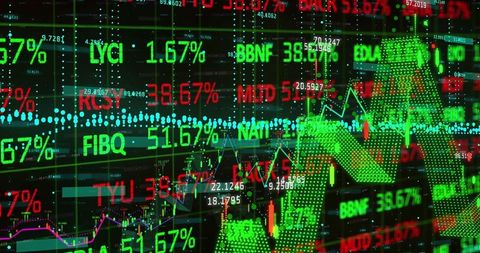
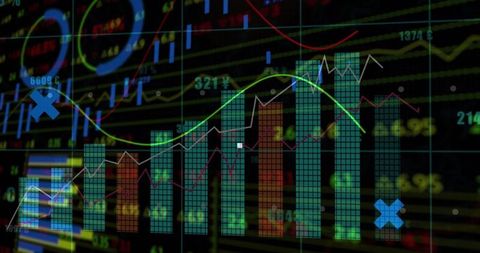
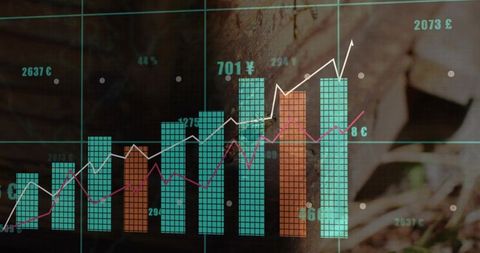
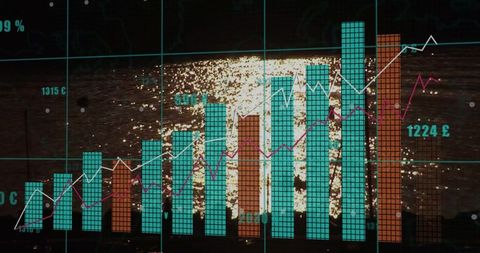
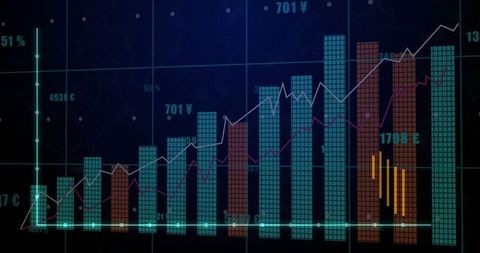
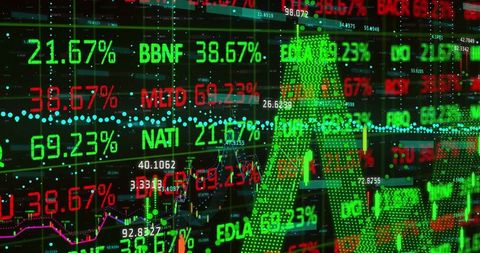
- Digital Financial Dashboard with Trending Market Data Analytics
Digital Financial Dashboard with Trending Market Data Analytics Image

This image displays a digital financial dashboard comprising bar charts and line graphs showcasing market trends. It's ideal for use in articles or presentations related to finance, investment strategies, trading platforms, and economic analysis. The advanced analytical data presentation makes it suitable for fintech applications, investment tutorials, and investment services marketing materials.

downloads
Tags:
More
Credit Photo
If you would like to credit the Photo, here are some ways you can do so
Text Link
photo Link
<span class="text-link">
<span>
<a target="_blank" href=https://pikwizard.com/photo/digital-financial-dashboard-with-trending-market-data-analytics/9da078ca6b7bdf2ebaf96993e8f2a5b5/>PikWizard</a>
</span>
</span>
<span class="image-link">
<span
style="margin: 0 0 20px 0; display: inline-block; vertical-align: middle; width: 100%;"
>
<a
target="_blank"
href="https://pikwizard.com/photo/digital-financial-dashboard-with-trending-market-data-analytics/9da078ca6b7bdf2ebaf96993e8f2a5b5/"
style="text-decoration: none; font-size: 10px; margin: 0;"
>
<img src="https://pikwizard.com/pw/medium/9da078ca6b7bdf2ebaf96993e8f2a5b5.jpg" style="margin: 0; width: 100%;" alt="" />
<p style="font-size: 12px; margin: 0;">PikWizard</p>
</a>
</span>
</span>
Free (free of charge)
Free for personal and commercial use.
Author: People Creations