- Home >
- Stock Photos >
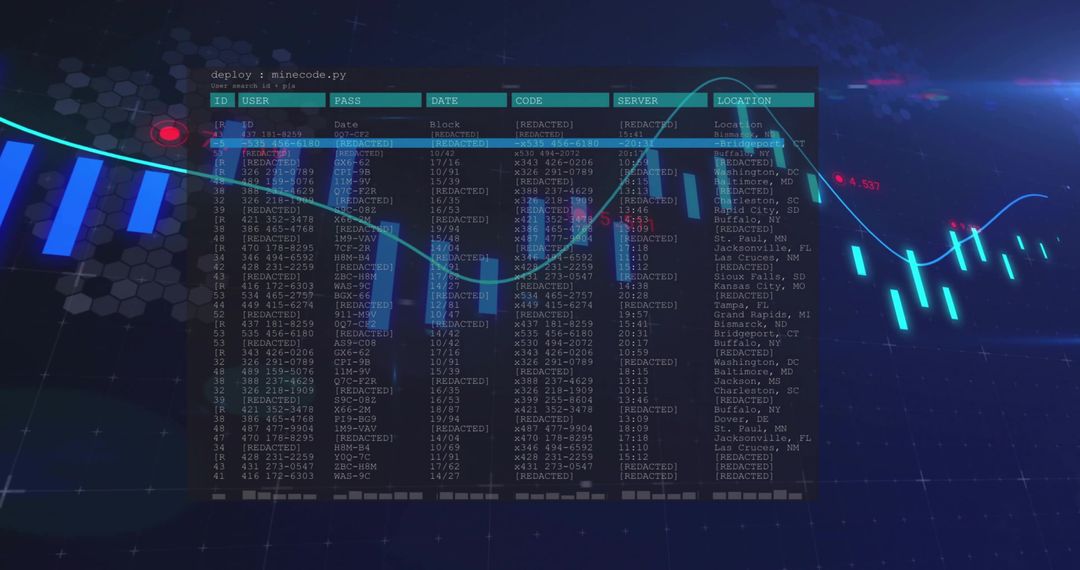
- Digital Financial Data Analysis and Global Business Interface
Digital Financial Data Analysis and Global Business Interface Image

The graphic depicts financial data processing with bars and lines against a dark futuristic backdrop. This visual is suitable for illustrating concepts such as global business strategies, financial analysis and prediction, algorithms, and technological impact in business. It is ideal for use in promotional materials for financial institutions, economic reports, digital marketing, or presentations on analytics and advanced data integrations.
Powered by  - Get 15% off with code: PIKWIZARD15


2
downloads
downloads
Tags:
More
Credit Photo
If you would like to credit the Photo, here are some ways you can do so
Text Link
photo Link
<span class="text-link">
<span>
<a target="_blank" href=https://pikwizard.com/photo/digital-financial-data-analysis-and-global-business-interface/22c6cceb567de7986fe2f4b71a833028/>PikWizard</a>
</span>
</span>
<span class="image-link">
<span
style="margin: 0 0 20px 0; display: inline-block; vertical-align: middle; width: 100%;"
>
<a
target="_blank"
href="https://pikwizard.com/photo/digital-financial-data-analysis-and-global-business-interface/22c6cceb567de7986fe2f4b71a833028/"
style="text-decoration: none; font-size: 10px; margin: 0;"
>
<img src="https://pikwizard.com/pw/medium/22c6cceb567de7986fe2f4b71a833028.jpg" style="margin: 0; width: 100%;" alt="" />
<p style="font-size: 12px; margin: 0;">PikWizard</p>
</a>
</span>
</span>
Free (free of charge)
Free for personal and commercial use.
Author: Awesome Content
Similar Free Stock Images
Premium


Premium


Premium


Premium


Premium


Premium


Premium


Premium


Premium


Premium


Premium


Premium


Premium


Premium


Premium


Premium


Premium


Premium


Premium


Premium


Premium


Premium


Premium


Premium