- Home >
- Stock Photos >
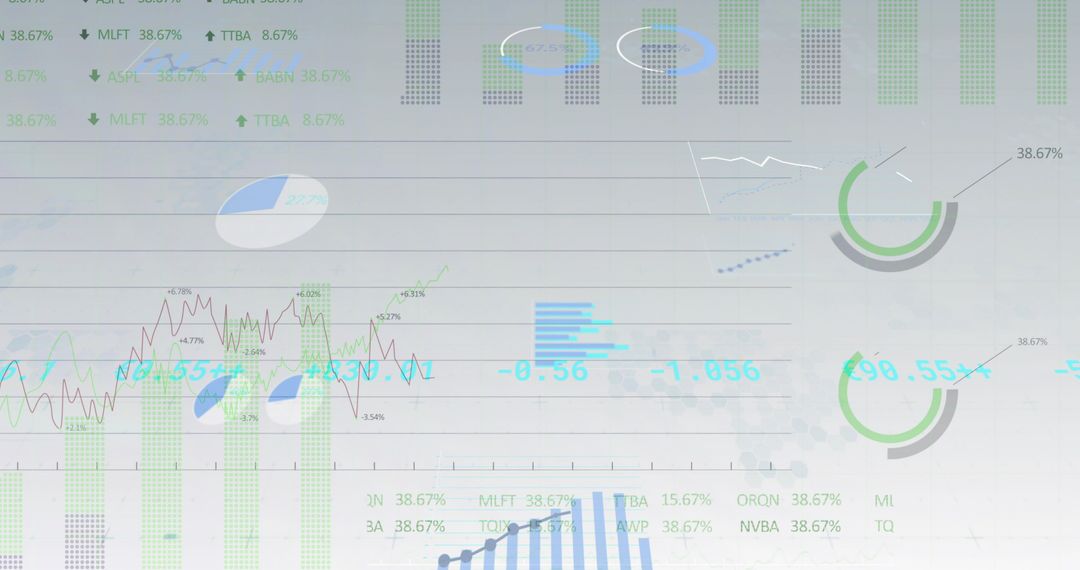
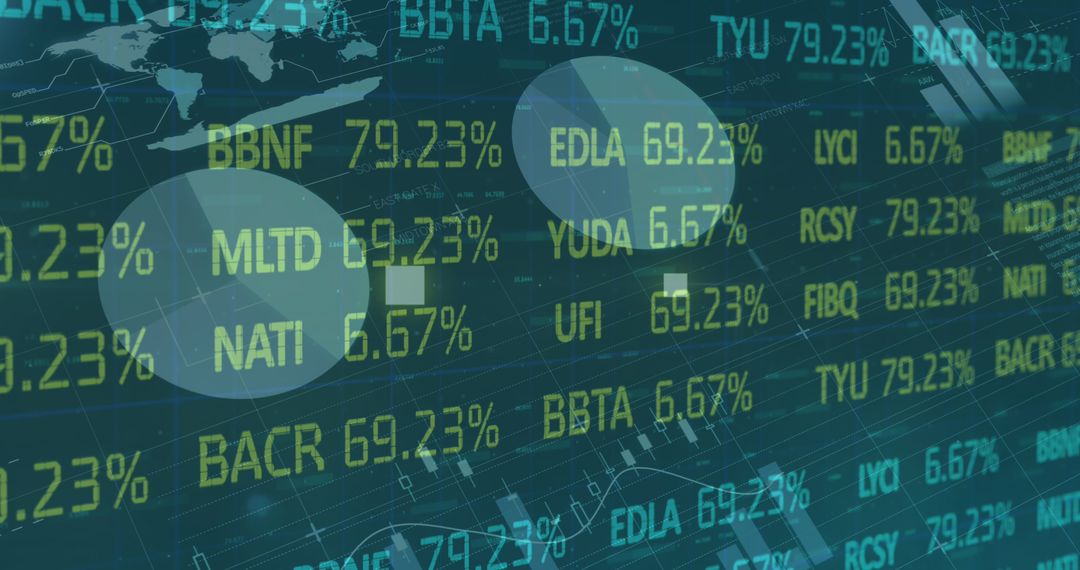
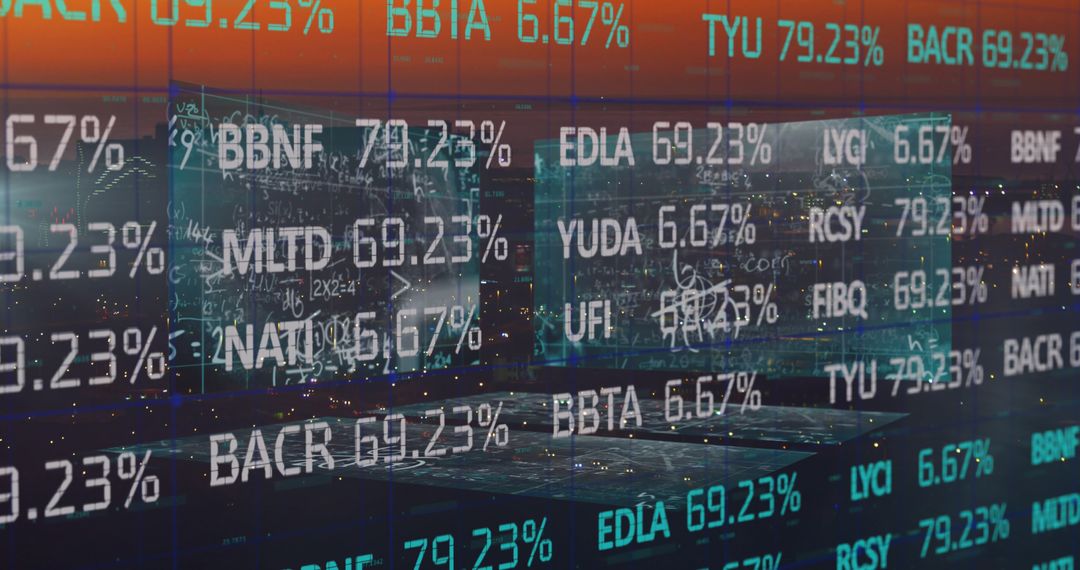
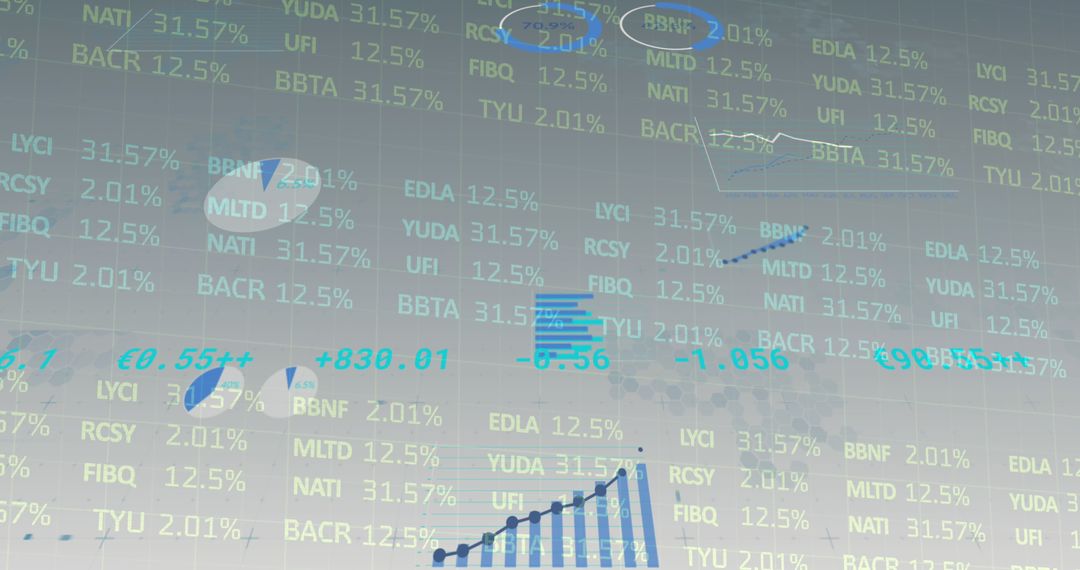
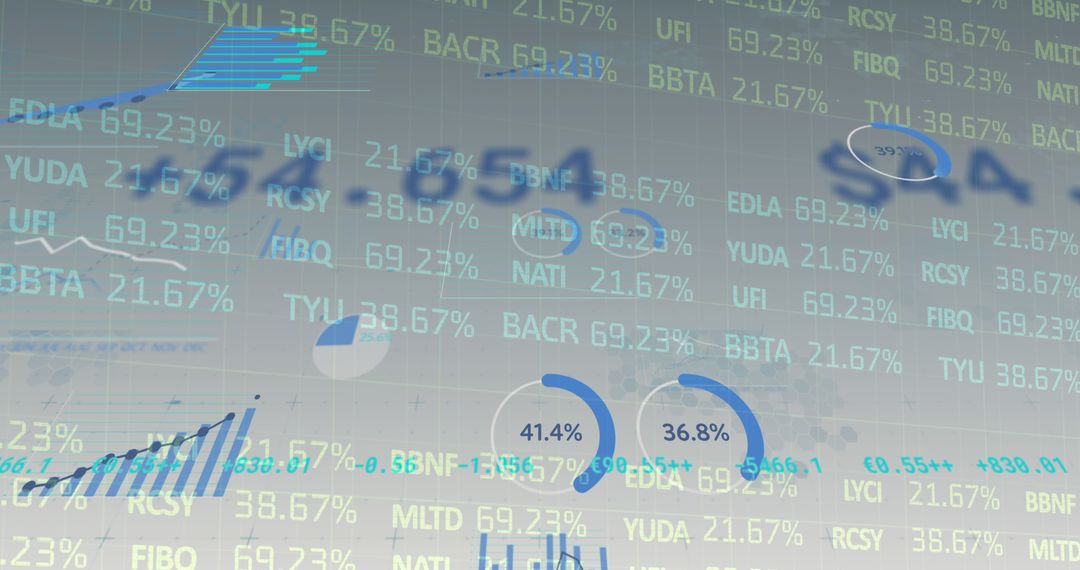
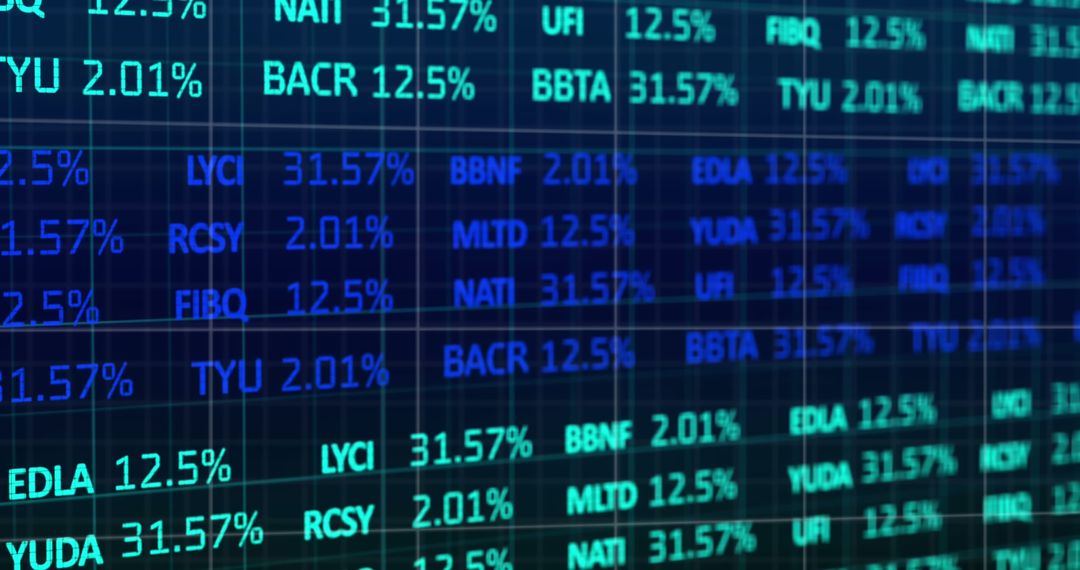
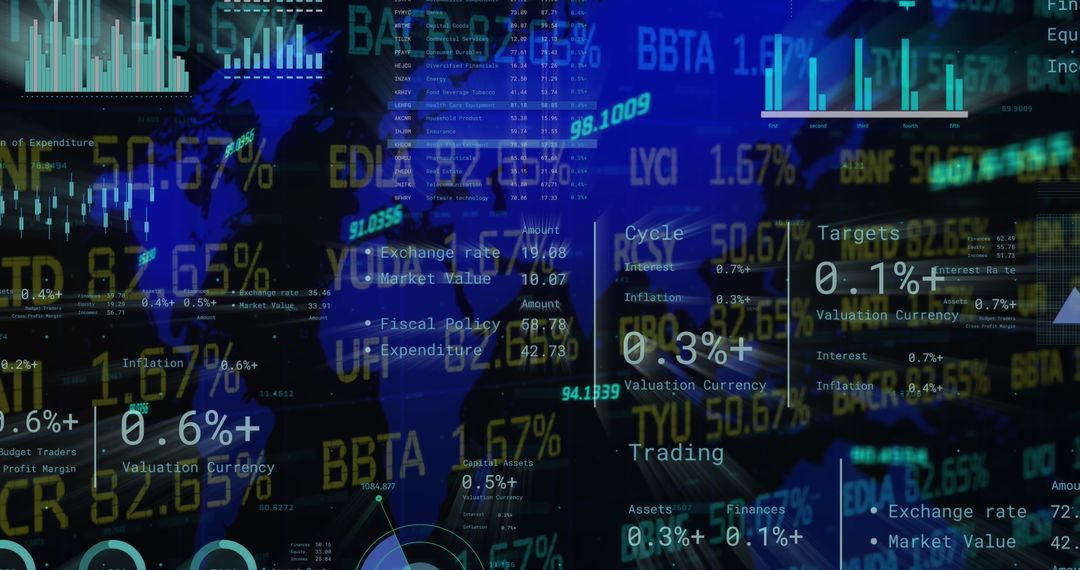
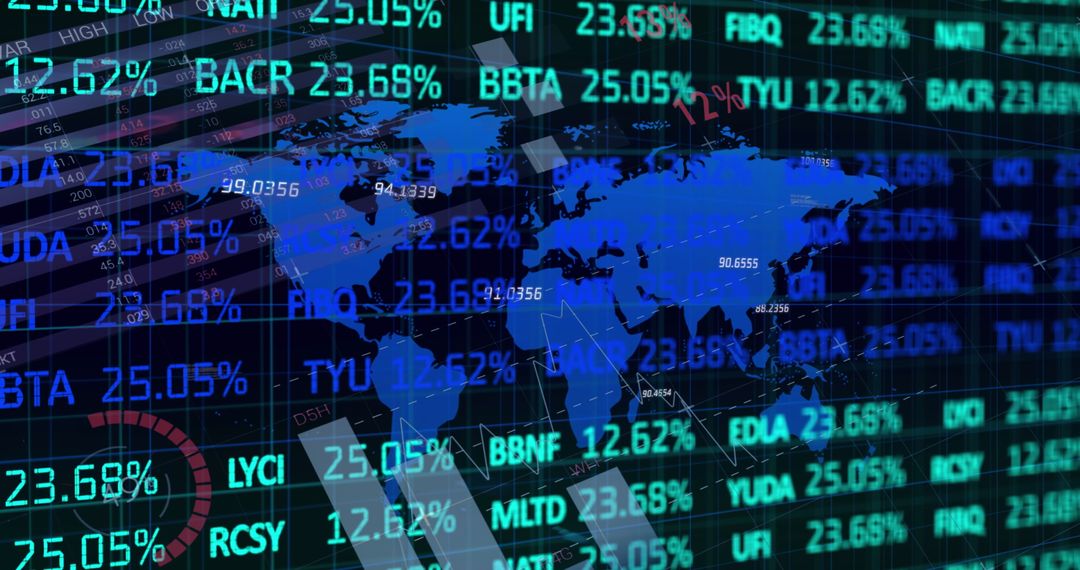
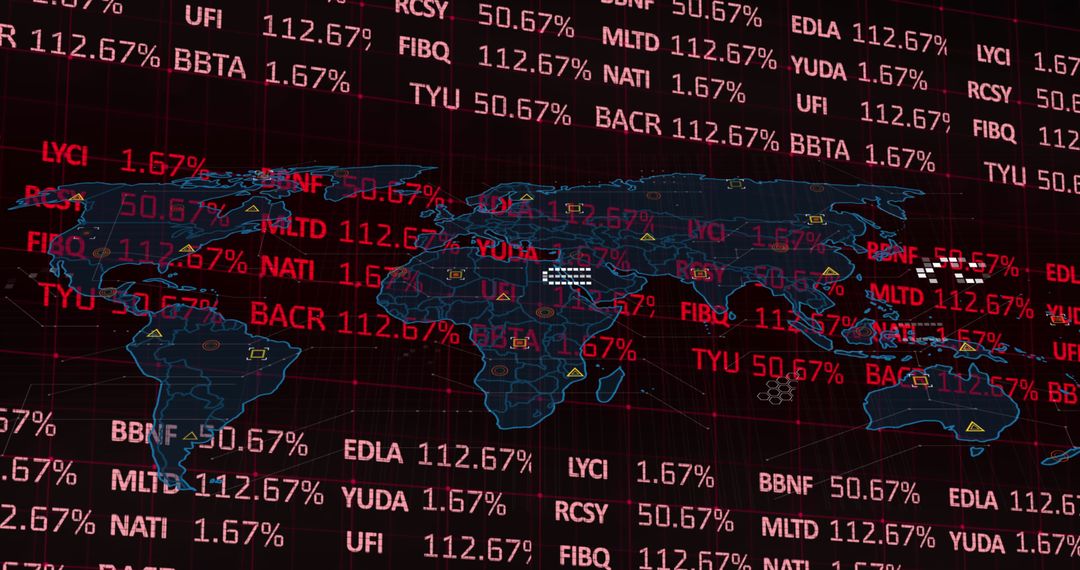
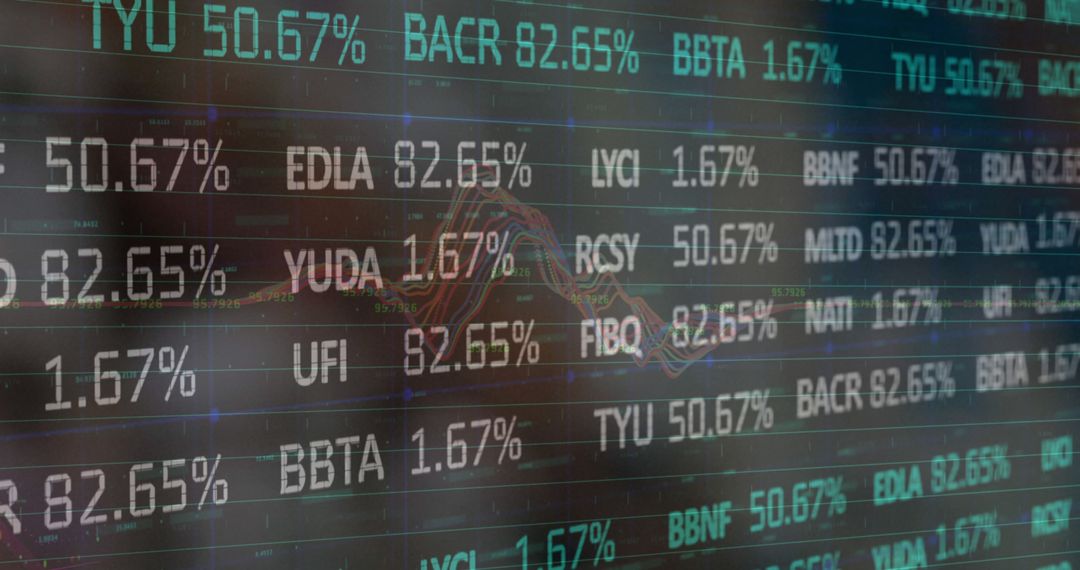
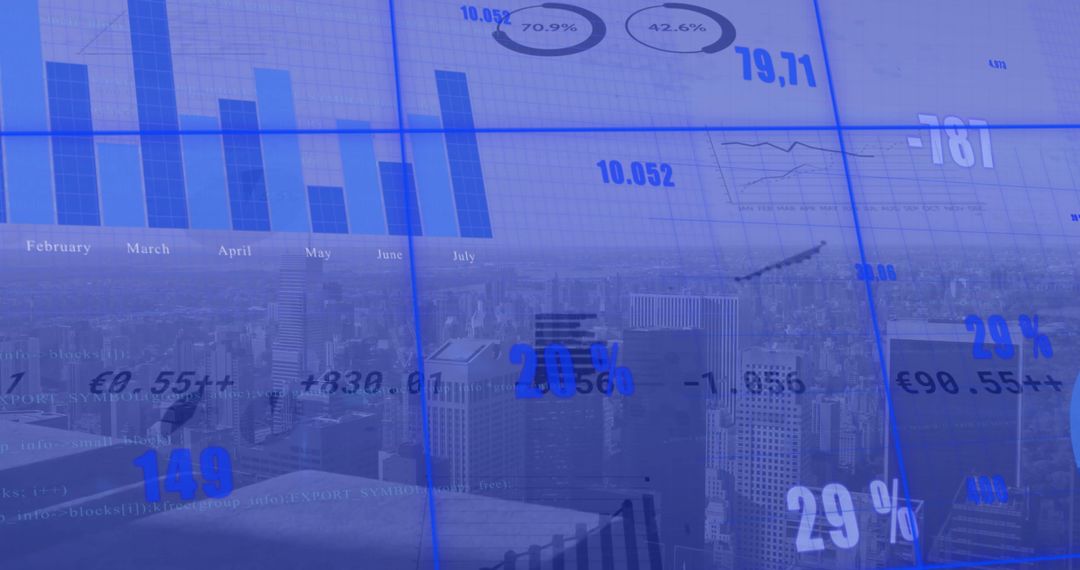
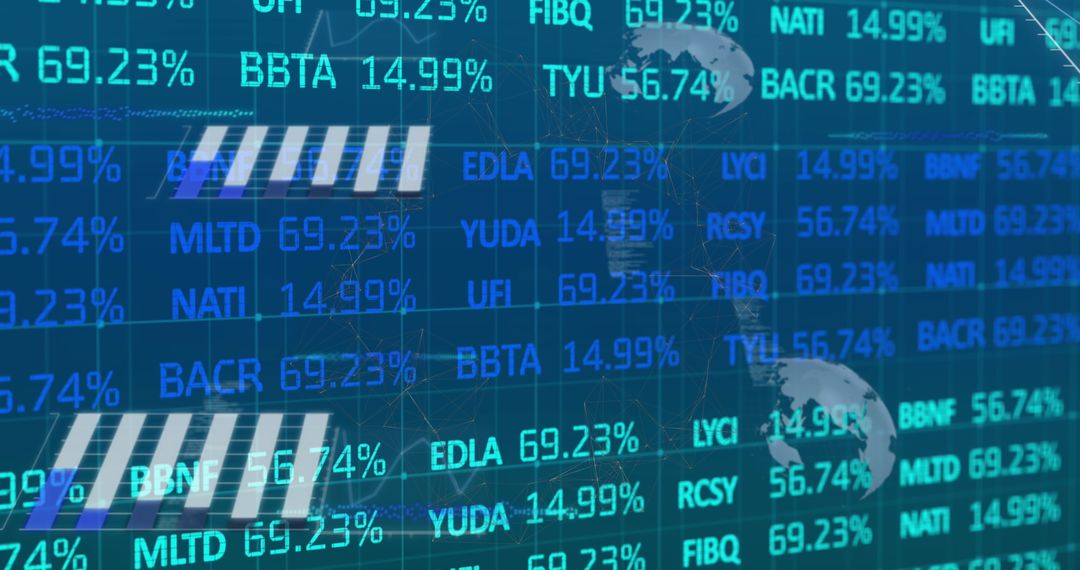
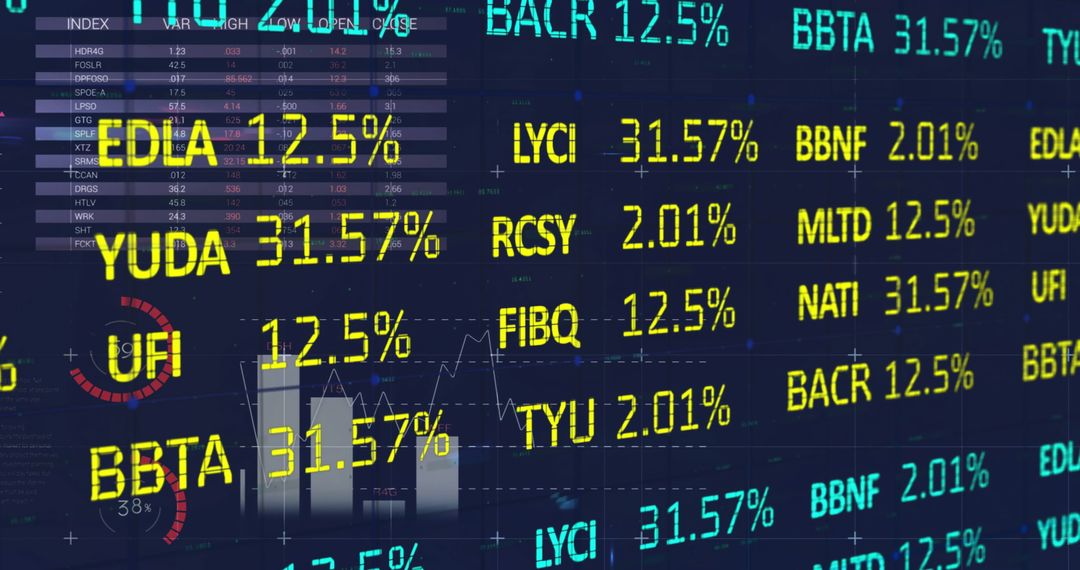
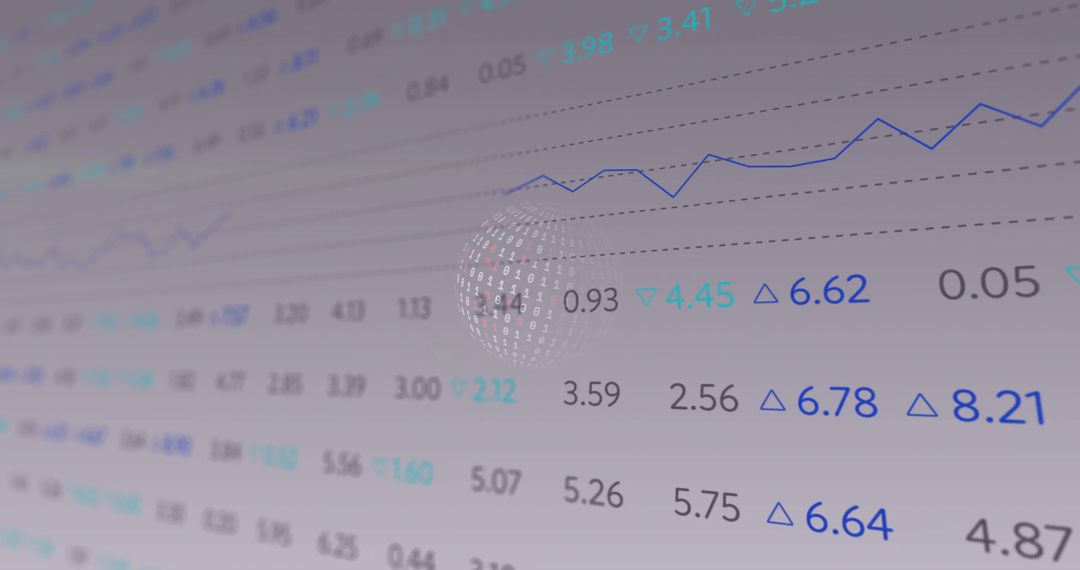
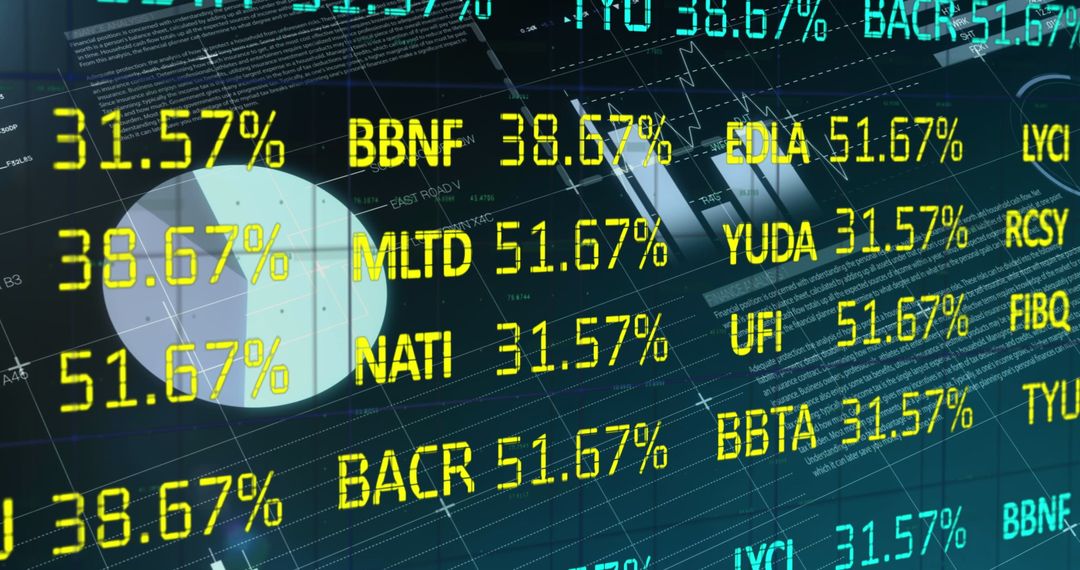
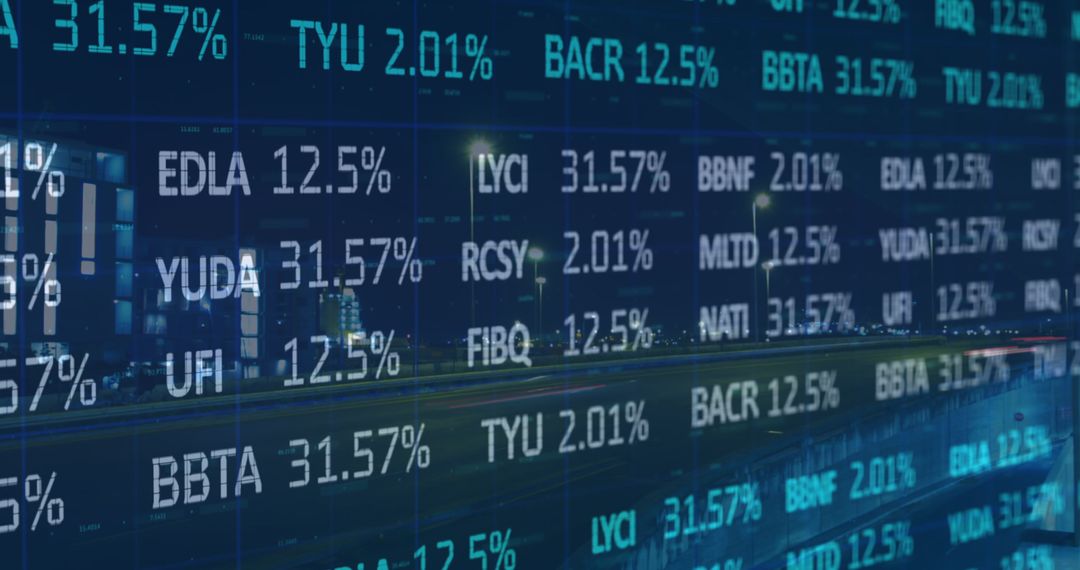
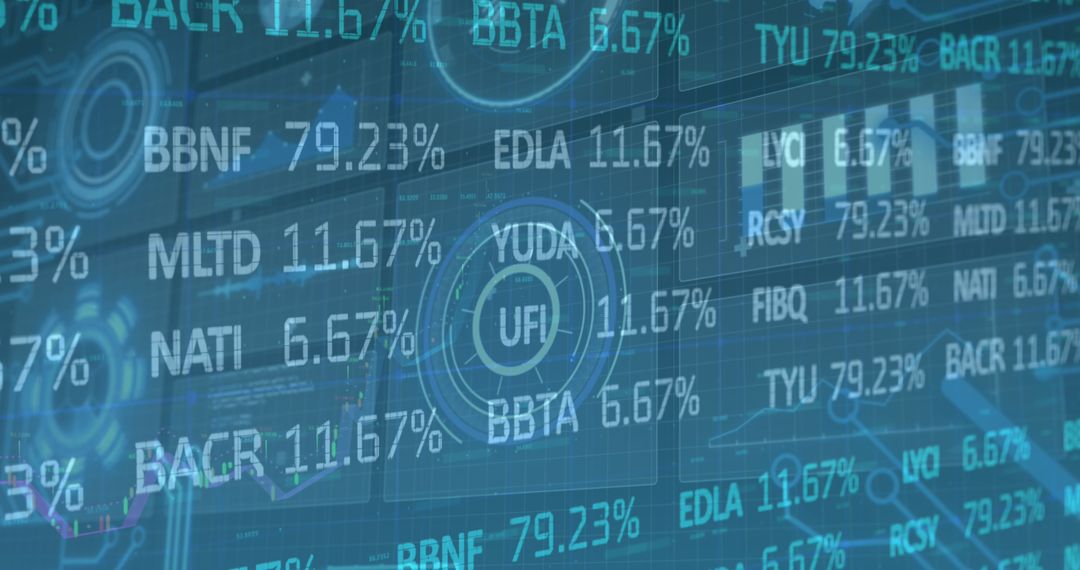
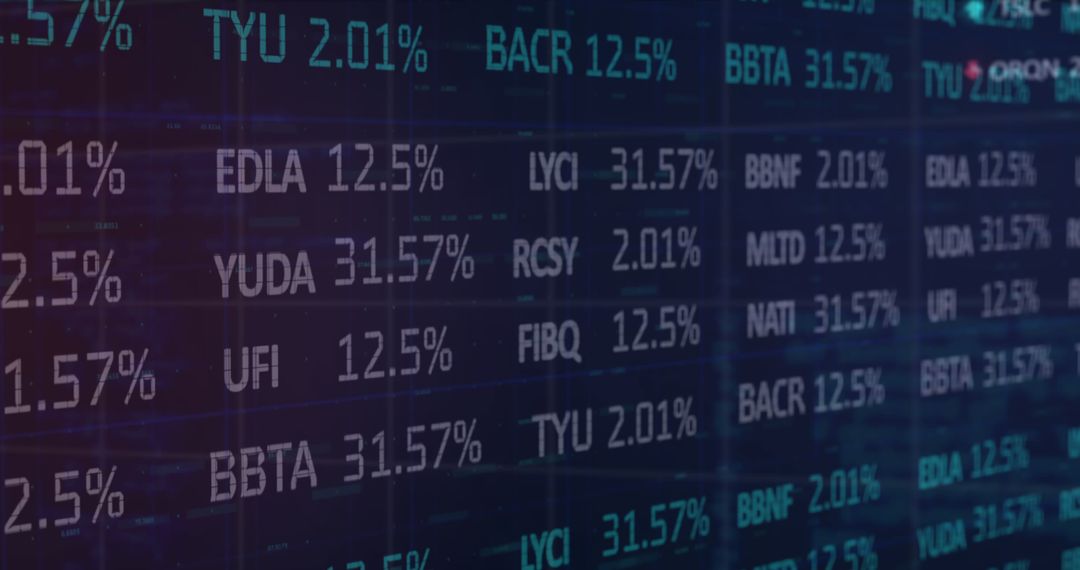
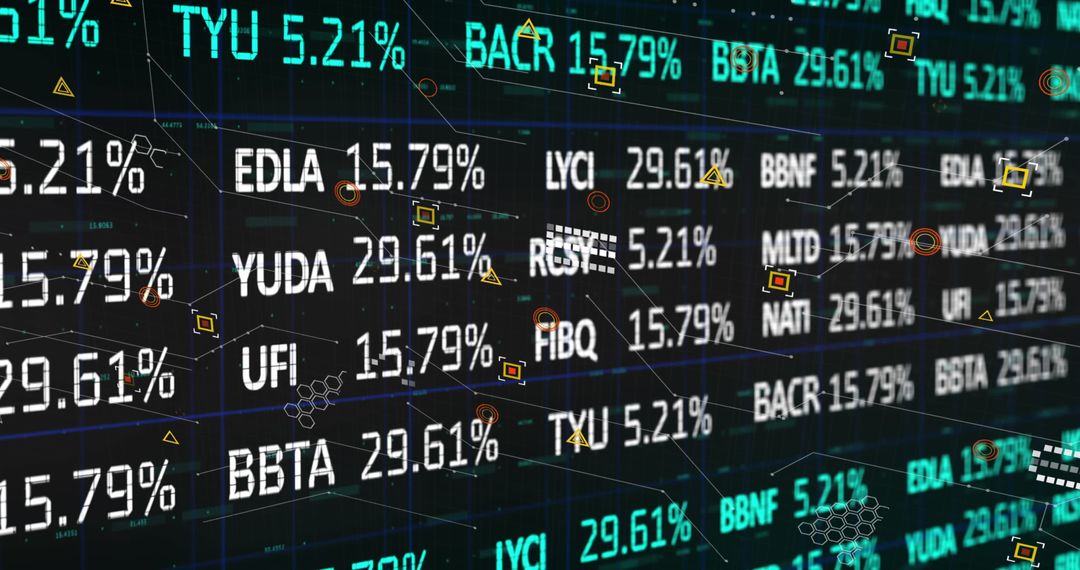
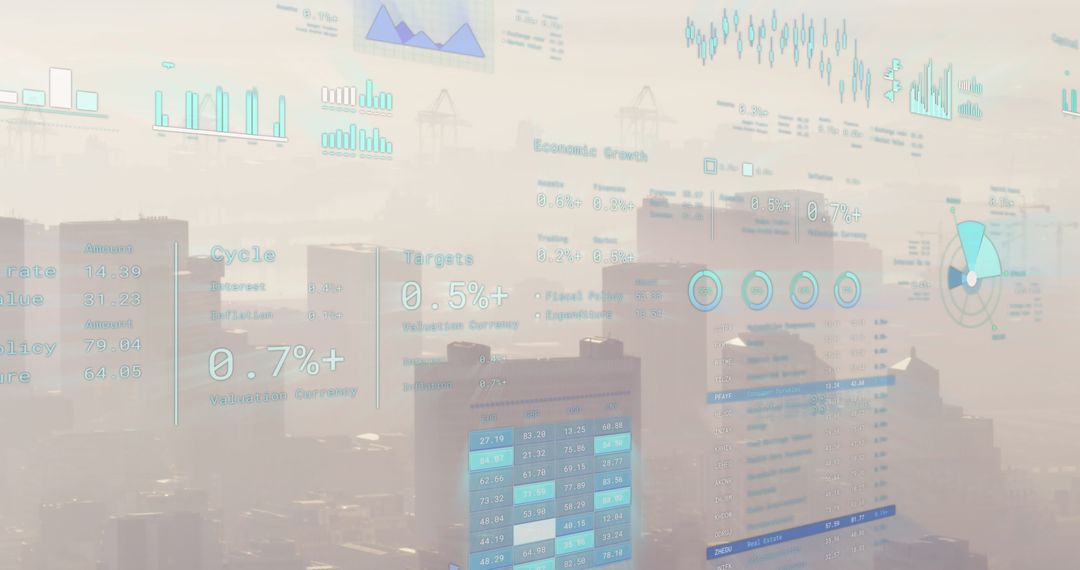
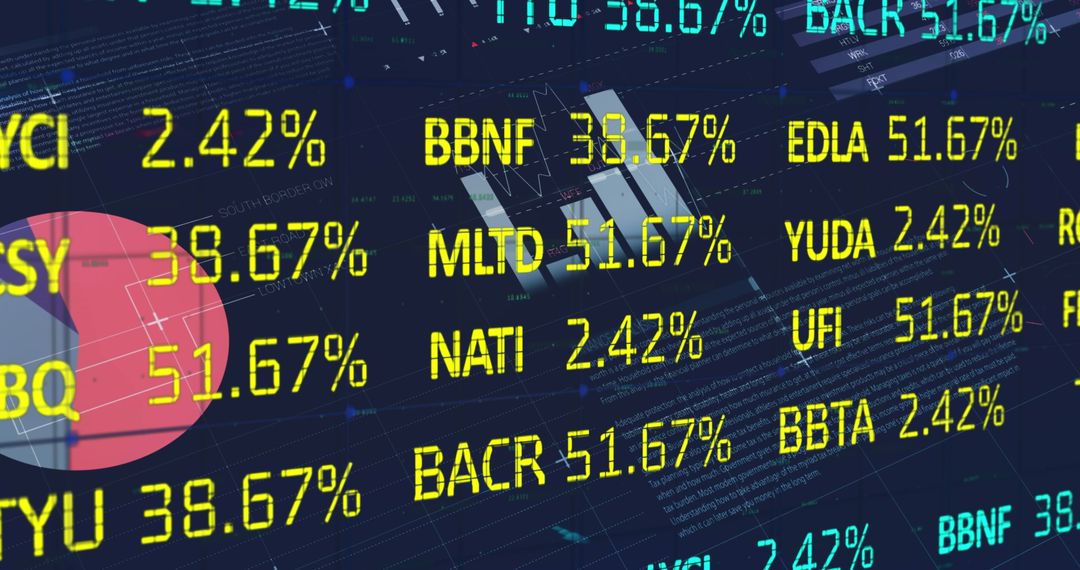
- Digital Financial Data Analysis and Stock Market Visualization
Digital Financial Data Analysis and Stock Market Visualization Image
Illustrates digital financial data analysis with virtual graphs and statistics. Ideal for business presentations, financial reports, stock market analysis resources, finance courses, and informative webinars.
Powered by 


2
downloads
downloads
Tags:
More
Credit Photo
If you would like to credit the Photo, here are some ways you can do so
Text Link
photo Link
<span class="text-link">
<span>
<a target="_blank" href=https://pikwizard.com/photo/digital-financial-data-analysis-and-stock-market-visualization/f7f05294090b2ac3184811bae85b4c26/>PikWizard</a>
</span>
</span>
<span class="image-link">
<span
style="margin: 0 0 20px 0; display: inline-block; vertical-align: middle; width: 100%;"
>
<a
target="_blank"
href="https://pikwizard.com/photo/digital-financial-data-analysis-and-stock-market-visualization/f7f05294090b2ac3184811bae85b4c26/"
style="text-decoration: none; font-size: 10px; margin: 0;"
>
<img src="https://pikwizard.com/pw/medium/f7f05294090b2ac3184811bae85b4c26.jpg" style="margin: 0; width: 100%;" alt="" />
<p style="font-size: 12px; margin: 0;">PikWizard</p>
</a>
</span>
</span>
Free (free of charge)
Free for personal and commercial use.
Author: Creative Art
Similar Free Stock Images
Premium


Premium


Premium


Premium

Premium


Premium


Premium


Premium


Premium

Premium

Premium

Premium


Premium

Premium


Premium


Premium


Premium


Premium


Premium


Premium


Premium


Premium


Premium


Premium