1. Home > 
  2. Stock Photos > 
  3. Digital Financial Data Analysis Background with Charts

Digital Financial Data Analysis Background with Charts Image

Digital Financial Data Analysis Background with Charts

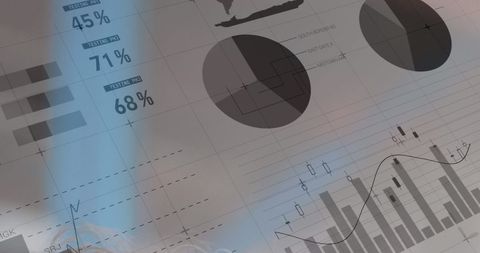
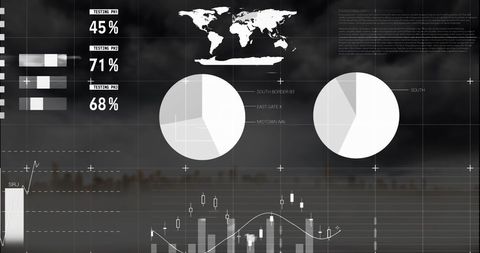
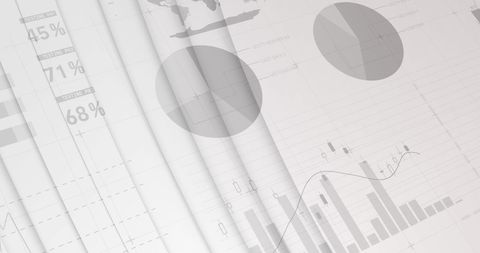
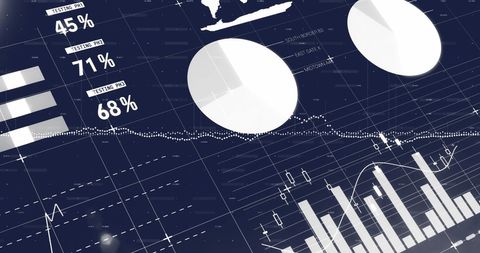
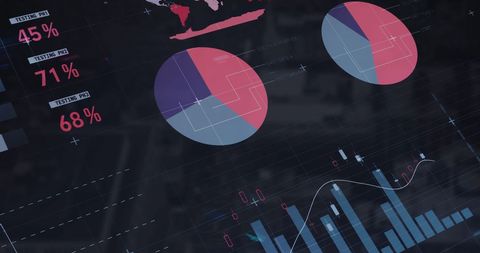
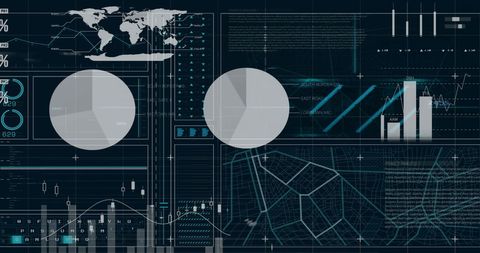
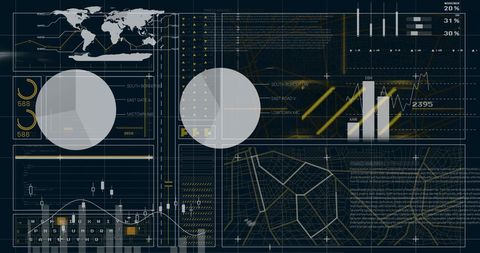
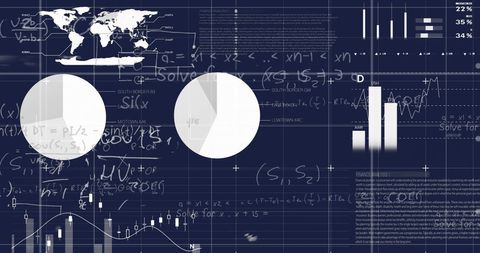
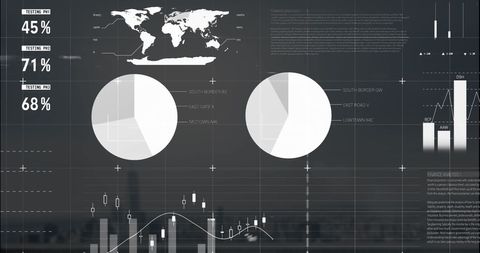
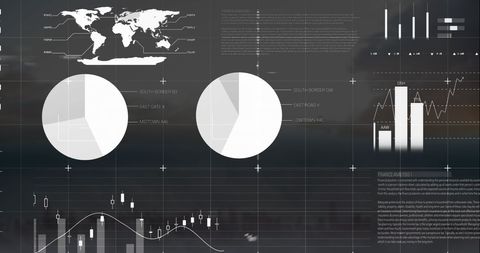
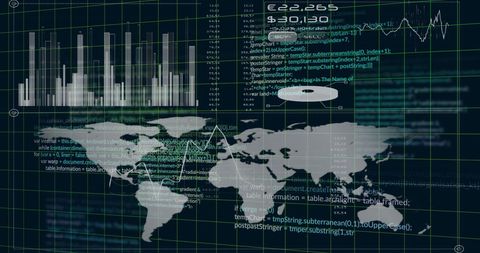
Abstract representation of financial data processing. Blue background features various charts and graphs, symbolizing global business dynamics. Ideal for illustrating concepts related to data analysis, stock markets, business forecasts, and tech-driven finance trends. Useful for websites, presentations, or financial reports depicting modern financial management.

Powered by Shutterstock logo - Get 15% off with code: PIKWIZARD15
Financial graph with uptrend line technology bar chart of stock market on blue color background - Powered by Shutterstock - Get 15% off with code: PIKWIZARD15Stock market chart with blue candlestick graph and trading data on a dark background, Stock market finance chart with business trading analytics, exchange data, and financial growth graph.	 - Powered by Shutterstock - Get 15% off with code: PIKWIZARD15Stock market business and exchange financial growth graph. Business chart data graph diagram, business trading graph investment growth, global trend arrow up and down. - Powered by Shutterstock - Get 15% off with code: PIKWIZARD15Businessman analyzing financial data using a digital tablet and holographic charts. - Powered by Shutterstock - Get 15% off with code: PIKWIZARD15Business data dashboard provide business intelligence analytic for marketing strategy planning snugly with big data set to analyze customer demands and foreseeing business future. - Powered by Shutterstock - Get 15% off with code: PIKWIZARD15

Credit Photo

If you would like to credit the Photo, here are some ways you can do so

Free (free of charge)

Free for personal and commercial use.

Author: Awesome Content

Similar Free Stock Images

Digital Financial Charts and Data Visualization 4K
Premium
Displaying financial data fluctuating on dashboard with turquoise line, data labels and golden arc. Data visualization, analytics, modern design, technological, data analytics, dashboard
Digital Interface with Financial and Statistical Data Visualizations
Business Analytics with Diverse Professionals Concept
Digital Financial Data and Cityscape Visualization
Dynamic Statistical Data Projection and Mathematical Equations
Global Statistical Data Analysis Interface on Blue Digital Screen
Abstract Grey Charts on White Business Background
Futuristic Interface with Data Highlights and Analytics
Digital Infographic Overlay on Modern Cityscape
High-Tech Data Analysis Interface with Graphs and Viewfinder
Abstract Visualization of Mathematical Equations with Graph Data
Abstract Financial Data Interface Enhancing Modern Cityscape
Premium
Business data analytics and intelligence dashboard concept, businessman using futuristic holographic graphs and charts on laptop, big data analysis, KPIs, statistics, digital transformation.
Global Financial Analysis Chart with Data Visualization
Digital Interface Displaying Data Analysis and Mathematical Equations
Abstract Business Infographic Interface Over Cityscape
Premium
A professional person analyzes financial growth and business data on a digital screen. Perfect for data science, market research, analytics dashboards, and corporate performance monitoring concepts.
Technology-Inspired Dashboard with Wireframe Sphere and Analytics
Global Data Processing and Analytics Interface
Abstract Digital Interface Displaying Data Analytics and Statistics
Premium
Businessman analyzing financial data on digital tablet.
Premium
laptop is open on a desk with a notebook and a stack of papers. The laptop screen displays a series of graphs and charts, suggesting that the user is working on a project or analyzing data
Abstract Financial Data Processing Over Grid with Charts
Digital Data Analytics over Modern Glass Building
Digital Data Visualization with Charts and Numbers Concept
Futuristic Financial Charts on Digital Interface Background
Premium
Digital bar graph with rising arrows and percentage symbol on laptop screen. Concept of financial growth, investment return, business analytics, and modern fintech data visualization.
Premium
Businessman analyzing virtual graph chart on laptop screen. Concept of data analysis, financial growth, performance tracking, digital technology, and business intelligence.
Abstract Data Processing Interface with Cityscape
Abstract Financial Data Analytics with Blurred Background
Futuristic Digital Data Visualization with Graph and Pie Chart
Abstract Data Analytics Visualization with Graphs and Charts
Digital Urban Statistics Visualization on Blue Background
Infographic Interface Display over Cityscape at Dawn
Digital Data Processing with Graphs and Maps Interface
Abstract Data Analysis with Mathematical Formulas on Dark Interface
Abstract Data Processing Over Maps and Charts in Digital Interface
Global Financial Data Visualization on Navy Background
Premium
Close Up Computer Display with Red and Green Candlestick Charts with Financial Stock Market Information. Business, Digital Banking, Trading Software, Finance and Economy Concept
Premium
Black man using stylus interacting with digital tablet displaying financial charts and graphs, analyzing business data at desk with printed documents and glass of water visible in background
Dynamic Financial Graph and Data Visualization Concept
Abstract Global Financial Data and Technology Interface
Dynamic Data Visualizations and Financial Statistics on Black Background
Abstract Digital Data Analytics With Mathematical Equations
Premium
Data analytics dashboard with charts, indicators, and performance metrics, reveals trends, data analytics drives growth, supports insight, and data analytics improves decisions. Vouch
Futuristic Interface with Statistical Data and Graphs
Digital Interface Displaying Data and Statistical Graphs
Digital Data Analysis Visualization with Graphs and Charts
Futuristic Data Analytics Interface with Glowing Graphs and Charts
Premium
Showing chart with candlestick bars, line graph, labels on screen, hex grid overlay, diagonal bars. Technology, finance, analytics, data, dashboard, visualization, digital
Cityscape Overlaid with Data Analytics Infographics
Mathematical Formulas and Data on Digital Interface
Digital Analytics Dashboard with Blue Pie Chart and Code Overlay
Data Processing Overlay on Digital Charts
Premium
kpi, analytics, dashboard, data, chart, A person analyzing digital KPI dashboards and charts on a laptop, representing performance metrics, data analytics, and business strategy.
Futuristic Data Visualization Overlay on Urban Sky
White Mathematics Formulas on Digital Data Interface Background
Futuristic Data Visualization with Business Graphs
Global Economy and Market Dynamics Conceptual Composite
Premium
Analyst Reviewing Data Charts on Computer Screens
Premium
Stock market investment. Trade graph analysis. Economy chart. Trader stock exchange. Stock market graph. Finance investment. stock graph chart margin diagram statistic report rate trend candle stick.
Infographic Interface Overlay on Modern Urban Architecture
Futuristic Data Analysis Digital Interface with Graphs and Equations
Premium
Crisis US economy, recession risk. Falling red color candlestick chart. Financial and stock market chart concept  background photo.
Financial Data Interfaces and Digital Analytics Concept
Digital Data Analytics on Blue Background
Digital Ruble Symbol Overlay on Data Visualization Interface
Digital Data Analysis and Processing Background Concept
Premium
stock market investment trading graph growth. Trade business analytics graph and financial chart.
Abstract Global Technology Background with Mathematical Equations
Digital Data Interface with Charts and Text Analysis
Futuristic Blue Data Analytics Interface with Graphs and Statistics
Global Financial Data Processing with Graphs and Charts
Premium
Futuristic Digital Growth Chart – 3D Bar Graph with Glowing Blue Data Visualization
Abstract Math and Science Data Visualization
Futuristic Infographic Analysis with Abstract Pattern Hologram
Monochromatic Digital Financial Charts 4K Resolution
Digital Statistical Data Interface with Mathematics Overlays
Digital Data Analysis Over Retail Cash Monitor
Premium
A business hand drawing a glowing rising graph with digital bars and arrows, symbolizing financial growth, data analytics, success, performance improvement, and modern business strategy in a digital
Infographic Interface Overlay with Cityscape Backdrop and Global Data
Digital Data Visualization with Graphs and Charts Overlay
Futuristic Digital Interface with Graphs and Charts in Blue Tones
Futuristic Data Dashboard with Charts and Annotations
Premium
Showing price labels and up or down triangle indicators on trading screen, with candlestick chart. Financial analysis, investment, market trends, digital dashboard, technical analysis, stock charts,
Complex Financial Analytics and Data Visualization in Digital Space
Statistical Data Overlay with Grid Network on Blue Background
Global Digital Data Interface with Charts and Graphs
Digital world: interactive data visualization dashboard
Statistical Data Visualization in Modern Business Context
Abstract Business Data Analytics and Statistics Visualization
Mathematical Equations and Data Charts on Digital Screen
Digital Financial Data Overlaid on Urban Cityscape
Futuristic Data Processing and Digital Interface Visual
Abstract Financial Chart with Pie and Bar Graphs on White Background
Premium
Visualizing central data analytics on digital interface, with pie charts bar graphs formulas. Futuristic, technology, visualization, infographics, digital, scientific, analytical
Premium
Development to success and motivation in 2026.Growth and development chart of company in new year 2026. Planning, opportunity, challenge and business strategy in new year 2026
Digital Data Visualization with Code and Analytical Charts
Premium
candlestick chart for financial markets with moving averages and elements of technical analysis
Fast Walkers and Financial Data merger Symbolizing Modern Business Pace
Dark Blue Financial Dashboard with Large Pale Pie Chart and Candlestick Graphs
Analyzing Business Data with Projected Graphs and Charts
Futuristic Data Visualization Over Earth's Horizon
Premium
Displaying finance dashboard on dark themed GUI, with vertical bar chart and curved line graph. Data analytics, finance, investment, data visualization, technology, dashboard, digital interface
Abstract Digital Interface with Global Data Visualization
Digital Display of Bitcoin Overlaid with Data Graphs
Data Processing Overlay on Urban Landscape with Graph
Digital Financial Data Charts over a Cloud Background
Premium
Businessperson analyzing financial growth with monthly bar chart and upward trend line on laptop. Concept of business analytics, performance tracking, and data-driven strategy.
Global Financial Data Chart and Graph Analysis Background
Digital Data Interface with Statistical Analysis and Charts
Futuristic Digital Financial Data Display Interface
Futuristic Global Data Processing on World Map Interface
Digital Interface Infographic on Cityscape Background
Digital Infographic Interface with Holographic Charts
Technology Concept with Seamless Integration of Digital Graphs and Transmission Towers
Global Financial Data Visualization and Analysis Design
Data Analysis Dashboard with Graphs and Charts on Blue Background
Premium
Businessman analyzing growth data using digital dashboard and laptop. Futuristic interface showing rising graph and financial metrics. Concept of smart investment, fintech, and business performance.
Global Finance and Data Processing Technology Concept
Data Visualization Display over Modern City
Digital Financial Data Analytics with Graphs and Charts
Global Data Visualization with Maps and Graphs
Futuristic Financial Chart Overlay with Cityscape Background
Explore More Free Stock Images