
- Home >
- Stock Photos >
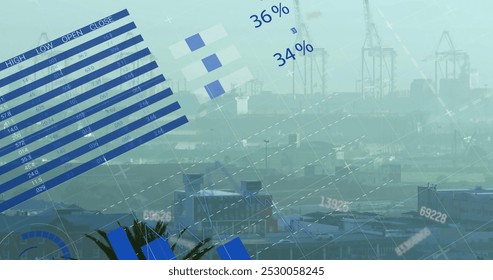
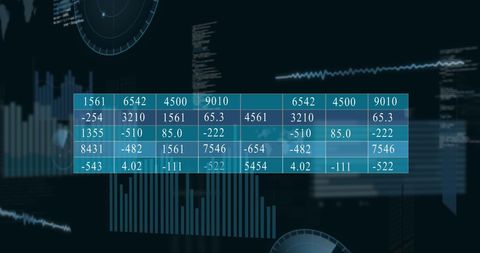
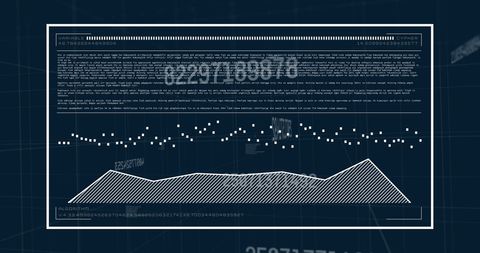
- Digital Financial Data Analysis Conceptual Background
Digital Financial Data Analysis Conceptual Background Image

Digitally generated background showing a dynamic representation of financial data with a virtual graph overlaid on a dark backdrop. Visually captures the processing and analysis of global finance trends and networks, useful for illustrating business or economic analysis themes, enhancing presentations, or developing informative digital content related to finance and data computing.
Powered by  - Get 15% off with code: PIKWIZARD15


downloads
Tags:
More
Credit Photo
If you would like to credit the Photo, here are some ways you can do so
Text Link
photo Link
<span class="text-link">
<span>
<a target="_blank" href=https://pikwizard.com/photo/digital-financial-data-analysis-conceptual-background/88d34b12229722bf30d67a8cdb3df95f/>PikWizard</a>
</span>
</span>
<span class="image-link">
<span
style="margin: 0 0 20px 0; display: inline-block; vertical-align: middle; width: 100%;"
>
<a
target="_blank"
href="https://pikwizard.com/photo/digital-financial-data-analysis-conceptual-background/88d34b12229722bf30d67a8cdb3df95f/"
style="text-decoration: none; font-size: 10px; margin: 0;"
>
<img src="https://pikwizard.com/pw/medium/88d34b12229722bf30d67a8cdb3df95f.jpg" style="margin: 0; width: 100%;" alt="" />
<p style="font-size: 12px; margin: 0;">PikWizard</p>
</a>
</span>
</span>
Free (free of charge)
Free for personal and commercial use.
Author: People Creations
Similar Free Stock Images

Premium

Premium

Premium


Premium


Premium


Premium


Premium


Premium

Premium

Premium

Premium


Premium


Premium


Premium


Premium


Premium


Premium


Premium


Premium


Premium


Premium

Premium


Premium


Premium


Premium


Explore More Free Stock Images