
- Home >
- Stock Photos >
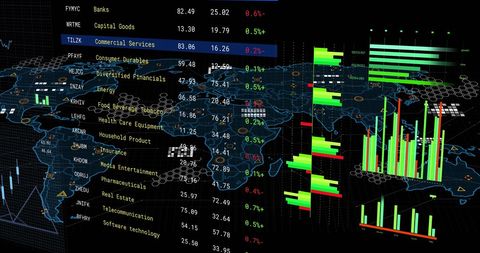
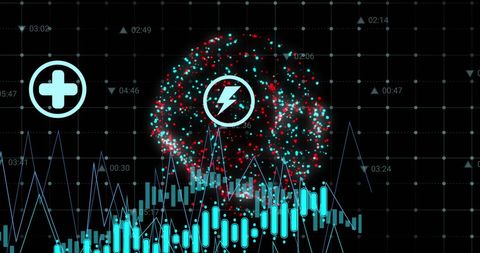
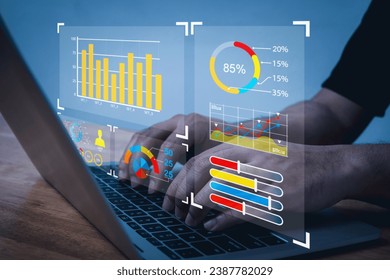
- Digital Financial Data Analysis in a Dark Themed Interface
Digital Financial Data Analysis in a Dark Themed Interface Image
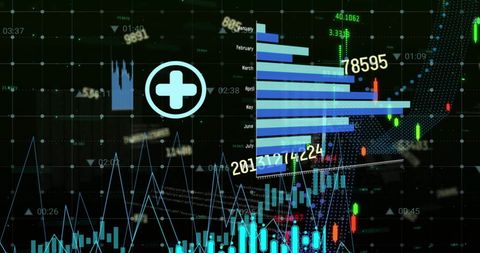
Digital interface showcasing financial data visually. Blue graphical charts surround background combining vertical and horizontal graph bars, fostering advanced data comprehension insights. Concept ideal for illustrating financial strategies, business reports, global market analysis, or emerging tech decor.
Powered by  - Get 15% off with code: PIKWIZARD15


downloads
Tags:
More
Credit Photo
If you would like to credit the Photo, here are some ways you can do so
Text Link
photo Link
<span class="text-link">
<span>
<a target="_blank" href=https://pikwizard.com/photo/digital-financial-data-analysis-in-a-dark-themed-interface/7a8c79b7dc5ff27d3e8865da57c416f4/>PikWizard</a>
</span>
</span>
<span class="image-link">
<span
style="margin: 0 0 20px 0; display: inline-block; vertical-align: middle; width: 100%;"
>
<a
target="_blank"
href="https://pikwizard.com/photo/digital-financial-data-analysis-in-a-dark-themed-interface/7a8c79b7dc5ff27d3e8865da57c416f4/"
style="text-decoration: none; font-size: 10px; margin: 0;"
>
<img src="https://pikwizard.com/pw/medium/7a8c79b7dc5ff27d3e8865da57c416f4.jpg" style="margin: 0; width: 100%;" alt="" />
<p style="font-size: 12px; margin: 0;">PikWizard</p>
</a>
</span>
</span>
Free (free of charge)
Free for personal and commercial use.
Author: People Creations
Similar Free Stock Images

Premium


Premium


Premium


Premium


Premium


Premium


Premium


Premium


Premium


Premium


Premium


Premium


Premium


Premium


Premium
Premium


Premium

Premium


Premium

Premium

Premium


Premium

Premium


Premium


Premium

Explore More Free Stock Images