1. Home > 
  2. Stock Photos > 
  3. Digital Financial Data Analysis Interface with Graphics

Digital Financial Data Analysis Interface with Graphics Image

Digital Financial Data Analysis Interface with Graphics

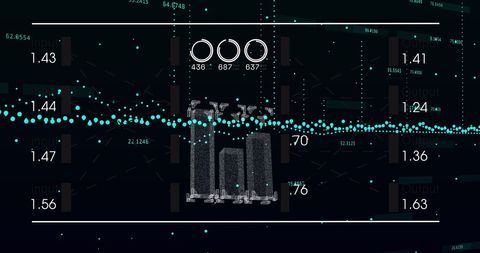
This depiction shows an abstract interface representing financial data analysis. It features graphic elements and numerical values on a digital landscape, illustrating money markets, data processing, and analytical operations. Ideal for use in articles or presentations related to finance technology, global trade analytics, or data-driven business solutions.

Powered by Shutterstock logo - Get 15% off with code: PIKWIZARD15
Data analysis science and big data with AI technology. Analyst or Scientist uses a computer and dashboard for analysis of information on complex data sets on computer. Insights development engineer  - Powered by Shutterstock - Get 15% off with code: PIKWIZARD15Big data analytics with AI technology. Data analyst analyzing and visualizing complex information network with artificial intelligence. Machine learning algorithm for business analytics and finance. - Powered by Shutterstock - Get 15% off with code: PIKWIZARD15Man look at the dashboard with graphs and charts. Concept of data management system, business intelligence, data statistics, marketing analysis, key performance indicators (KPI) and analytics. - Powered by Shutterstock - Get 15% off with code: PIKWIZARD15Man look at the dashboard with graphs and charts. Concept of data management system, business intelligence, data statistics, marketing analysis, key performance indicators (KPI) and analytics. - Powered by Shutterstock - Get 15% off with code: PIKWIZARD15Scientist working with business data, finance, marketing report, Big Data Analytics technology, Processing Complexity information flow on virtual screen, machine learning, artificial intelligence, ML - Powered by Shutterstock - Get 15% off with code: PIKWIZARD15

Credit Photo

If you would like to credit the Photo, here are some ways you can do so

Free (free of charge)

Free for personal and commercial use.

Author: People Creations

Similar Free Stock Images

Abstract Financial Chart Technology Interface
Premium
Businessman analyze and visualize complex information on a virtual screen using AI to process data. Big data technology and data science.Data flow.Digital neural network.artificial intelligence
Digital Financial Graph with Dynamic Trading Analysis
Digital Financial Data Analytics Wand Big Affect SEO Tools Commercial
Economic Trends Analysis with Financial Indicators and Graphs
Digital Data Visualization with Blue Grid and Timeline
Premium
Data science. Innovation technology, digital software development concept. Algorithm and deep learning of AI artificial intelligence, data engineering and global network. data processing technology.
Financial Data Processing with Digital Patterns for Global Business
Futuristic Binary Code and Financial Data Visualization
Digital Graphs Representing Data and Analytics on Black Background
Financial Data and Blood Vessels Fusion Exploring Adaptive Business Intelligence
Premium
Coworkers Team Modern Office.Account Managers Work New Business Startup Presentation Process.Man Signing Charts Global Marketing Plan.Laptop Computer Wood Table.HiTech Diagram Interface Screen.Concept
Graph Showing Stock Market Activity and Financial Data Analysis
Dynamic Financial Data Analysis in Digital Interface
Abstract Data Visualization with Dynamic Charts and Graphs
Digital Finance Analytics and Technological Data Visualization
Premium
Data science. Man programmer using digital tablet computer analyzing and develop software on futuristic virtual interface screen. Algorithm, big data analysis and management, data visualization
Digital Graph with Rising and Falling Lines on Grid Background
Financial Data Graph Over Cityscape with Digital Overlay
Data Trends Overlayed on Cityscape Skyscrapers
Data Analysis Graphics on Digital Grid Background
Premium
Data Management System (DMS) with Business Analytics concept. businessman working with provide information for Key Performance Indicators (KPI) and marketing analysis onn virtual computer
Global Business Finance Data Analysis Visualization
Dynamic Financial Data with Overlaid Cityscape Interface
Dynamic Red Line Graph With Data Points on Gridded Background
Dynamic Stock Market Data Visualization for Financial Analysis
Premium
Woman Touching Screen Electronic Tablet Hand.Project Managers Researching Process.Business Team Working New Startup modern Office.International Digital Diagrams Interfaces.Analyze market stock.Blurred
Financial Data Analytics with Digital Visualization Concept
Digital Data Processing Displaying Graphs Over Blurred Background
Colorful Data Waveforms on Digital Analytics Dashboard Interface
Visualizing Data Insights with Minimal Dashboard Metrics Trend
Dynamic Financial Data Visualization with Blue Trends
Financial Graph and Cityscape Analysis with Technological Overlay
Premium
Data science, business analysis and strategy, big data concept.Business teamwork analyzing financial graph on virtual touch screen, futuristic technology solution for business development
Futuristic Global Business Data with Digital Interface
Digital Finance: Modern Stock Market Analysis Display
Dynamic Financial Graph on Digital Background
Stagflation Concept with Digital Graphs and Data Patterns
Premium
Risk assessment and management concept, Business Woman touch on Low levels of risk management, Evaluation measure analytics technology, Business, Financial, Health, Human resource, Insurance
Financial Data Analysis Displayed on Server Infrastructure
Digital Fingerprint with Graph on Data Interface
Digital Financial Data Processing with Glowing Indicators
High-Tech Financial Data Analysis Display with Graphs
Premium
Analytical data and development statistics. Web analytics and product testing techniques are being measured. A guy studies an SEO dashboard and a digital report.
Digital Data Visualization with Trend Lines and Percentage Changes
Colorful Bar Graph with Data Overlay on Black Background
Abstract Financial Data Visualization with Graphs
Graphical Data Analysis on Digital Interface
Premium
financial analytics, business man working with charts, fintech
Digital Data Visualizations With Green Graphs and Bars
Abstract Data Visualization on Blue Background for Technology Concept
Advanced Financial Data Network Over World Map
Digital Virus Concept with Binary Code and Circuit Pattern
Premium
Data document content management system search and online file transfer download or doc sharing and database digital cloud drive storage service on computer network technology analytics concepts
Digital Stock Market Graph with Abstract Coding Background
Glowing Financial Graph with World Map in Dark Background
Futuristic Financial Data Analysis with Graphs and Charts
Dynamic Financial Data with Fluctuating Graph Lines
Premium
AI agent and intelligent automation IA technology. Business process automation BPA system. Businessman using laptop computer to give instructions to AI at desk in office.
Minimalistic Digital Financial Analytics Chart with Candlesticks
Dynamic Financial Data Visualization with 3D Graphs and Candlesticks
Displaying Falling Candlestick Chart on Dark Data Dashboard with Teal Axis and Metrics
Digital Financial Data Visualization with Urban Cityscape
Dynamic Financial Data Visualization over Urban Silhouette
Digital Heart Rate Monitor with Vital Signs Interface
Premium
Back rear view of young asian woman, freelance data scientist work remotely at home coding programmer on Big data mining, AI data engineering, IT Technician Works on Artificial Intelligence Project.
Digital Financial Graph with Tech Symbols on Red Background
Futuristic Graph and Data Visualization Interface Design
Abstract Technology with Financial Data and Graphs on Black Background
Futuristic Financial Data Visualization on Digital Interface
Premium
Digital business marketing data management on virtual screen, Businessman use laptop work marketing analysis chart strategic planning analytics dashboard with management data work in modern office
Global Finance and COVID-19 Impact Representation
Dynamic Data Analysis over Virtual Grid with Neural Patterns
Abstract Digital Financial Data Chart with Pink Line Oscillations
Digital Stock Market Chart and Networking Interface
Premium
Man Typing Keyboard Laptop Hand.Project Manager Researching Process.Business Team Working Startup modern Office.Global Strategy Virtual Icon.Innovation Graphs Interfaces.Analyze market stock.Blurred
Dynamic Data Visualization with Financial Charts and 3D Elements
Global Network Analysis with Dynamic Digital Data
Abstract Futuristic Data Network and Digital Finance Concept
Data Visualization on Security Shield Interface for Cyber Security
Premium
Business Analytics (BA) technology uses data mining, automation and predictive modeling for useful insights and decision making, concept with icons on a virtual screen with consultant in background
Data Visualization on Digital Grid with Technological Interface
Financial Data Analysis with Abstract Chart Grid Overlay
Digital Data and Financial Charts on White Background
Global Financial Data on Virtual Screen Displaying Stock Market Trends
Premium
Big data and AI technology, Business intelligence and AI data science, Automating data processing, Machine learning and business intelligence, AI driven data processing, KPI performance monitoring.
Dynamic Data Graphs Display on Dark Digital Background
Futuristic Digital Data Analysis Interface Visualization
Financial Graphs Over Candlestick Chart Indicating Stock Fluctuations
Dynamic Graphic of Financial Data Displayed on Graph
Premium
Image of financial data processing over dark background. global connections, data processing and digital interface concept digitally generated image.
Futuristic Financial Data with Moving Candle Stick Chart
Displaying Neon Waveform Analytics HUD Showing Colorful Oscillating Data Lines
Financial Data Chart Over City Silhouette
Dynamic Financial Data Elements on Abstarct Grid
Digitized Financial Data Interface Overlaying Urban Landscape
Futuristic Data Processing Animation with Media Icons
Premium
Analyst use laptop working with business analytics and data management system, make a report with KPI and metrics connected to database.Corporate strategy for finance, operations, sales, marketing
Data Security with Tech Bar Graph Overlay
Digital Data Network with Dynamic Connections
Digital Financial Data Analysis with Infographics and Charts
Digital Data Processing on Global Technological Interface
Premium
close up ceo businesswoman hand point on dashboard screen tablet device for ask and share idea or consulting with businessman partner for business team and work from home concept
Futuristic Digital Network with Data Streams and Connections
Analyzing Financial Graphs with Real-Time Data Trends
Digital Stock Market Analysis with Graphs and Charts
Data Analysis with Advanced Technology Interface Details Profusion
Premium
Business data analytics and robotic process automation management with a consultant touching connected gear cogs with KPI financial charts and graph, marketing dashboard
Digital Data Chart on Grey Background with Red Trend Line
Holographic Financial Data Visualization with Stock Trends
Dynamic Financial Data Against Urban Skyline
Digital Network Connections with Financial Icons on Virtual Display
Premium
Image of financial data processing over diverse business people in office. Global finance, business, connections, computing and data processing concept digitally generated image.
Financial Data Analysis on Blue Digital Interface
Dynamic Financial Data Processing in Green Sphere
Analyzing Financial Data on Digital World Map Background
Financial Data Overlaid on Server Room Showing Business Growth
Premium
Expert woman asian female people review data number costing managerial account prepare monthly actual cost variance report at tax audit office. ESG sheet budget control ERP process service project.
Abstract Data Graph with Dynamic Charts and Indicators
Digital Data Processing with Floating Point Graphics
Digital Financial Data Graph on Black Screen Background
Abstract Data Visualization with Circular Markers and Numeric Labels
Premium
Financial data on a monitor as Finance data concept. Analytics Report Status Information Analysis Chart Graph in digital screen. Business analyzing financial statistics displayed on the tablet screen.
Animating red radar gauge centering holographic data dashboard with 2009 and 2019 timelines