
- Home >
- Stock Photos >
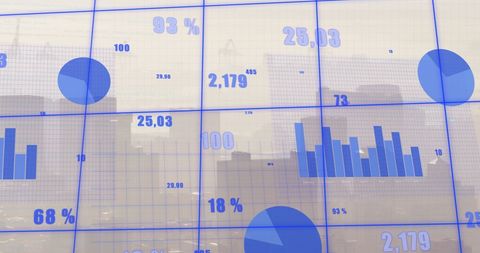
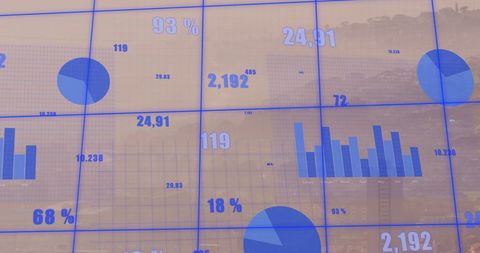
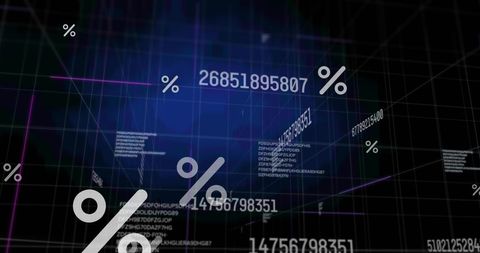
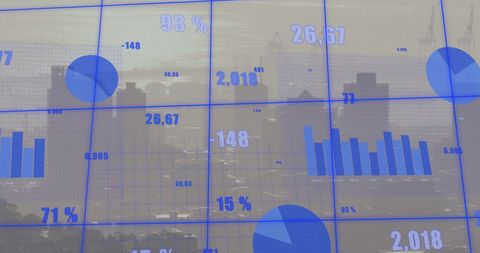
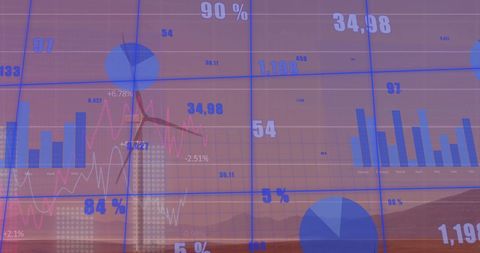
- Digital Financial Data Analysis on Black Background
Digital Financial Data Analysis on Black Background Image

This visually compelling representation of digital financial data displays numbers and percentages on a strategic black background, symbolizing financial analytics and modern infrastructure. Perfect for illustrating concepts related to economic analysis, financial technology, and business forecasts. Ideal for use in presentations, financial reports, tech articles, or educational materials related to finance and business strategy.
Powered by 


downloads
Tags:
More
Credit Photo
If you would like to credit the Photo, here are some ways you can do so
Text Link
photo Link
<span class="text-link">
<span>
<a target="_blank" href=https://pikwizard.com/photo/digital-financial-data-analysis-on-black-background/33e746d61c50a83685e2f0eb6ddd78b4/>PikWizard</a>
</span>
</span>
<span class="image-link">
<span
style="margin: 0 0 20px 0; display: inline-block; vertical-align: middle; width: 100%;"
>
<a
target="_blank"
href="https://pikwizard.com/photo/digital-financial-data-analysis-on-black-background/33e746d61c50a83685e2f0eb6ddd78b4/"
style="text-decoration: none; font-size: 10px; margin: 0;"
>
<img src="https://pikwizard.com/pw/medium/33e746d61c50a83685e2f0eb6ddd78b4.jpg" style="margin: 0; width: 100%;" alt="" />
<p style="font-size: 12px; margin: 0;">PikWizard</p>
</a>
</span>
</span>
Free (free of charge)
Free for personal and commercial use.
Author: Awesome Content
Similar Free Stock Images

Premium


Premium


Premium


Premium


Premium


Premium


Premium


Premium


Premium


Premium


Premium


Premium


Premium


Premium

Premium


Premium


Premium

Premium


Premium


Premium


Premium


Premium

Premium


Premium

Premium


Explore More Free Stock Images