
- Home >
- Stock Photos >
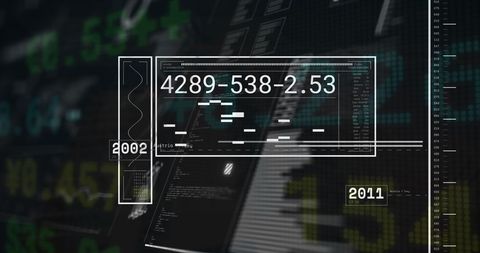
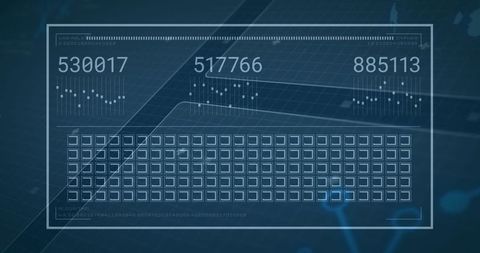
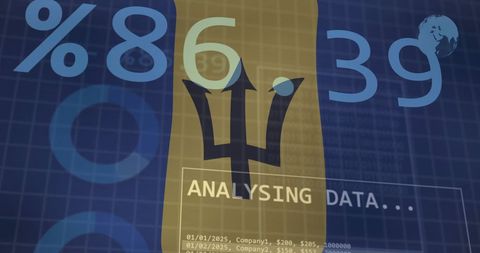
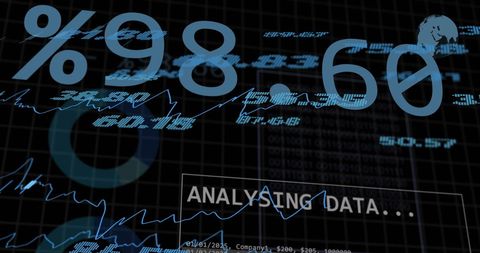
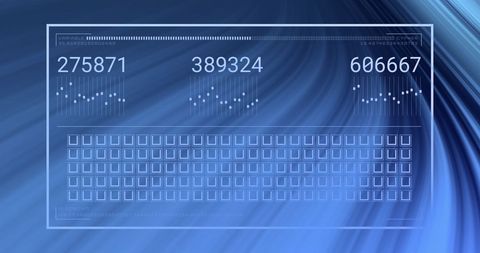
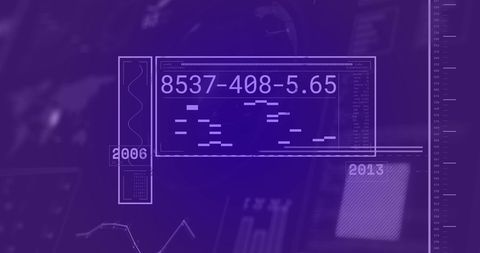
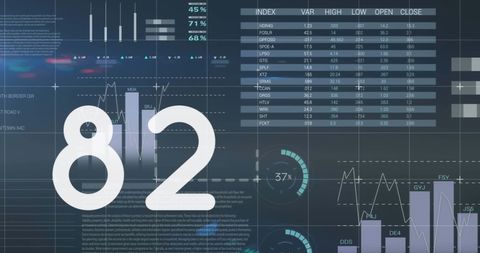
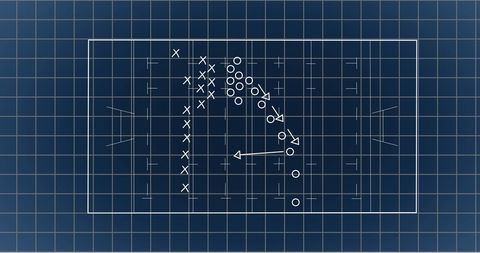
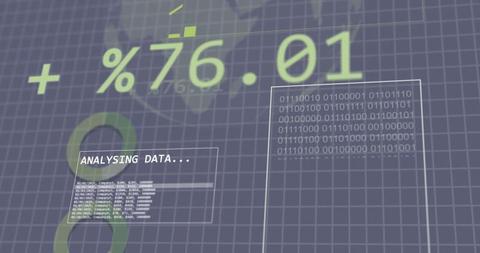
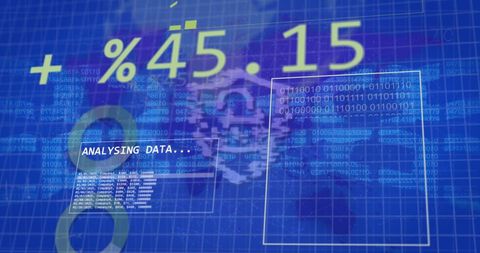
- Digital Financial Data Analysis on Dark Interface
Digital Financial Data Analysis on Dark Interface Image

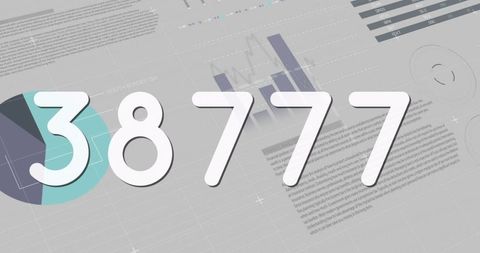
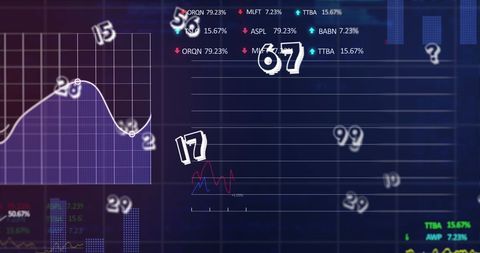
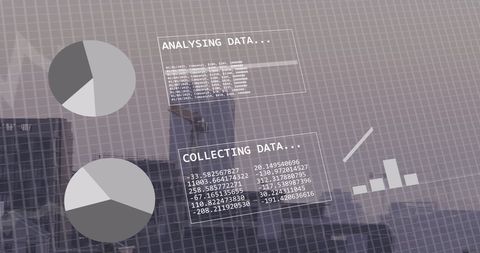
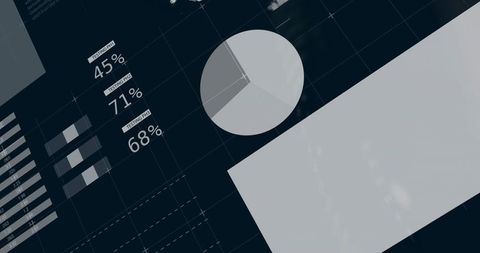
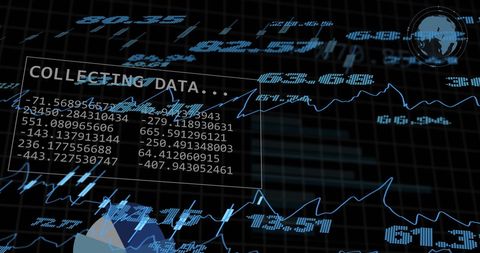
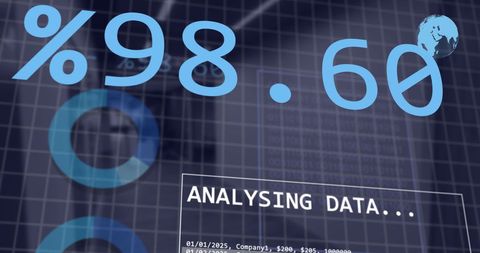
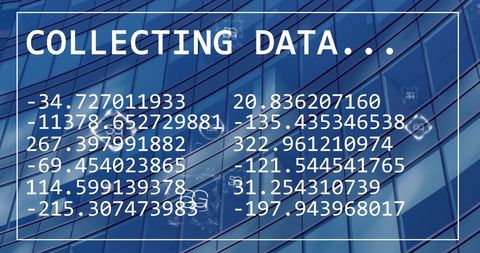
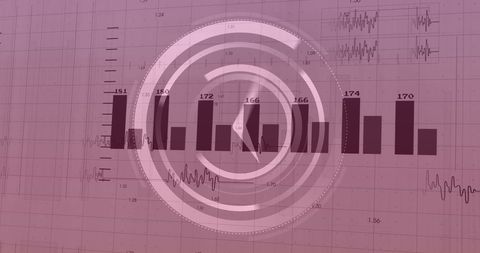
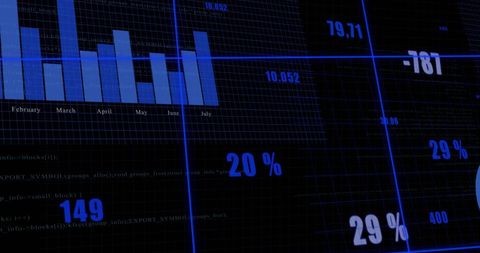
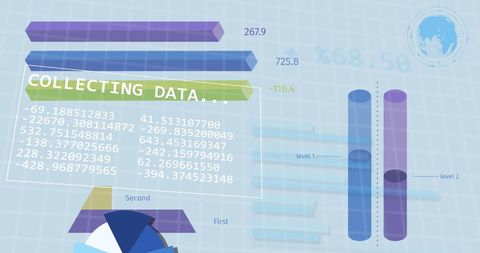
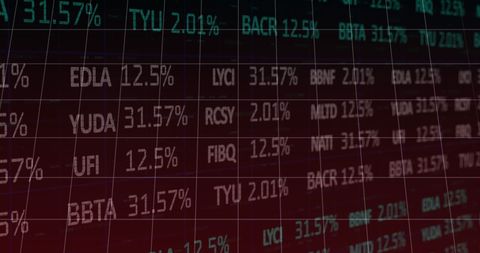
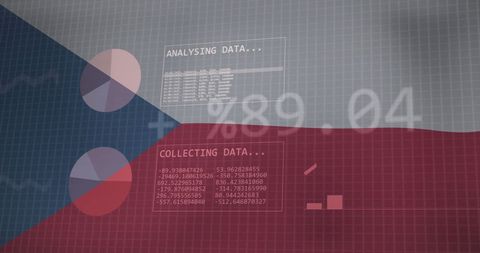
Visual depicting digital financial data analysis on a dark technological interface. Lines of code and numerical data are displayed, creating an impression of active data processing crucial for business and finance sectors. Suitable for illustrating finance software, business operation visuals, or data consulting services.
Powered by 


downloads
Tags:
More
Credit Photo
If you would like to credit the Photo, here are some ways you can do so
Text Link
photo Link
<span class="text-link">
<span>
<a target="_blank" href=https://pikwizard.com/photo/digital-financial-data-analysis-on-dark-interface/58adaffdf8aedba1fd820e9c47522081/>PikWizard</a>
</span>
</span>
<span class="image-link">
<span
style="margin: 0 0 20px 0; display: inline-block; vertical-align: middle; width: 100%;"
>
<a
target="_blank"
href="https://pikwizard.com/photo/digital-financial-data-analysis-on-dark-interface/58adaffdf8aedba1fd820e9c47522081/"
style="text-decoration: none; font-size: 10px; margin: 0;"
>
<img src="https://pikwizard.com/pw/medium/58adaffdf8aedba1fd820e9c47522081.jpg" style="margin: 0; width: 100%;" alt="" />
<p style="font-size: 12px; margin: 0;">PikWizard</p>
</a>
</span>
</span>
Free (free of charge)
Free for personal and commercial use.
Author: Awesome Content
Similar Free Stock Images
Premium


Premium

Premium


Premium


Premium


Premium


Premium


Premium


Premium

Premium

Premium


Premium


Premium


Premium


Premium


Premium

Premium


Premium


Premium


Premium


Premium


Premium


Premium


Premium


Premium

Explore More Free Stock Images