
- Home >
- Stock Photos >
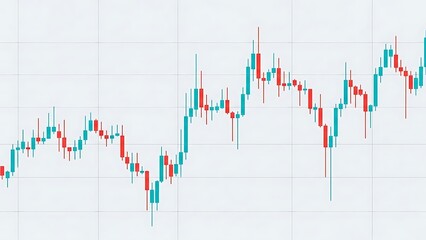
- Digital Financial Data Analysis on Grid Framework
Digital Financial Data Analysis on Grid Framework Image

This image illustrates digital financial data processing with a grid interface on a dark background. Dynamic graphs and numerical data suggest increasing interaction of global finance with digital technologies. Use this in content relating to data analytics, tech strategies, cybersecurity, or modern business processing operations.
Powered by 


downloads
Tags:
More
Credit Photo
If you would like to credit the Photo, here are some ways you can do so
Text Link
photo Link
<span class="text-link">
<span>
<a target="_blank" href=https://pikwizard.com/photo/digital-financial-data-analysis-on-grid-framework/45dd6a128648bdd6fff78683ec40d040/>PikWizard</a>
</span>
</span>
<span class="image-link">
<span
style="margin: 0 0 20px 0; display: inline-block; vertical-align: middle; width: 100%;"
>
<a
target="_blank"
href="https://pikwizard.com/photo/digital-financial-data-analysis-on-grid-framework/45dd6a128648bdd6fff78683ec40d040/"
style="text-decoration: none; font-size: 10px; margin: 0;"
>
<img src="https://pikwizard.com/pw/medium/45dd6a128648bdd6fff78683ec40d040.jpg" style="margin: 0; width: 100%;" alt="" />
<p style="font-size: 12px; margin: 0;">PikWizard</p>
</a>
</span>
</span>
Free (free of charge)
Free for personal and commercial use.
Author: Authentic Images
Similar Free Stock Images

Premium


Premium

Premium


Premium


Premium


Premium


Premium

Premium

Premium

Premium


Premium


Premium


Premium


Premium

Premium
Premium


Premium


Premium


Premium


Premium


Premium


Premium


Premium

Premium

Premium


Explore More Free Stock Images