- Home >
- Stock Photos >
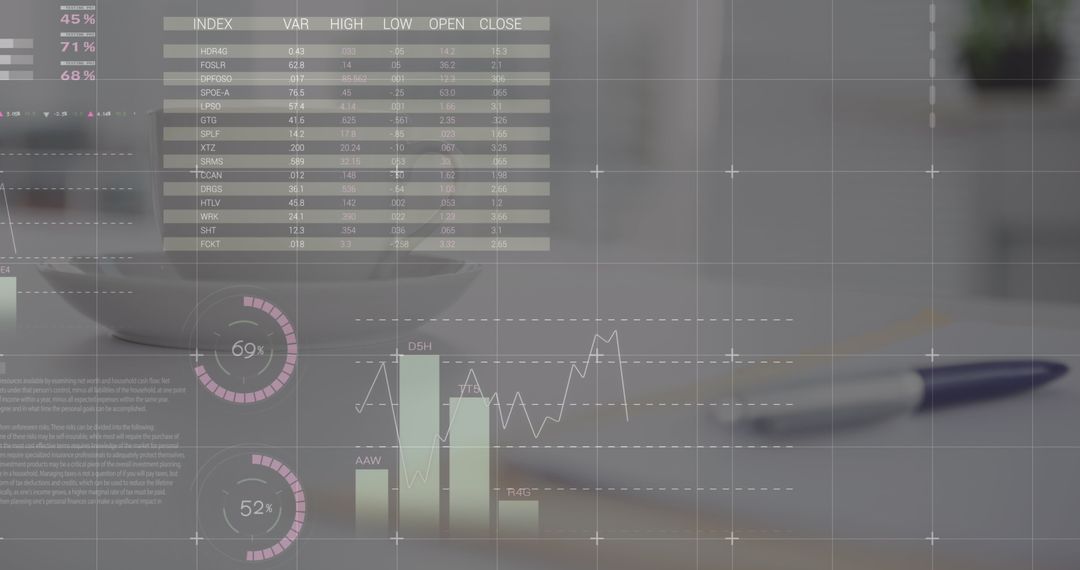
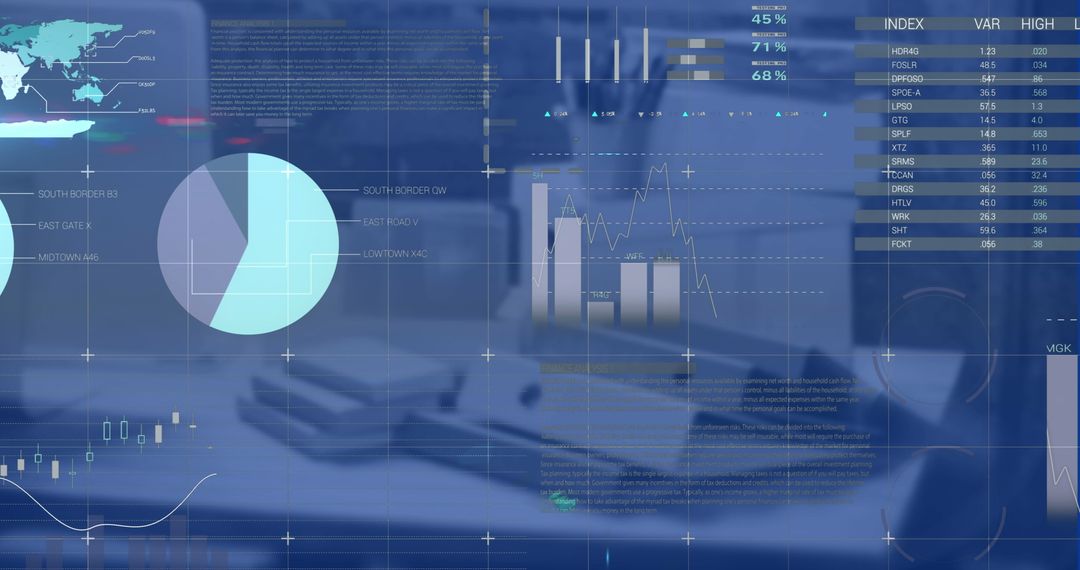
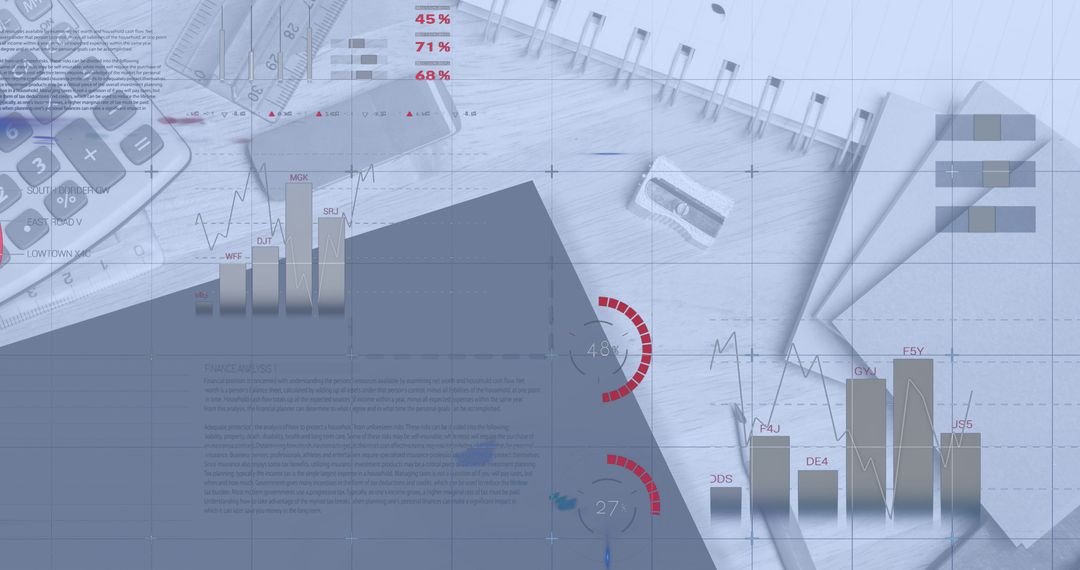
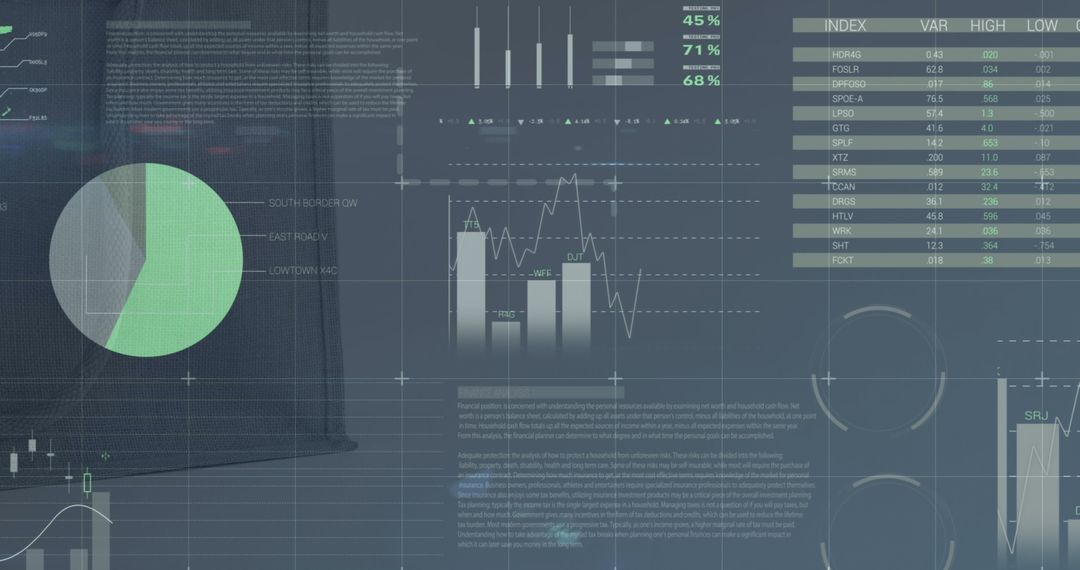
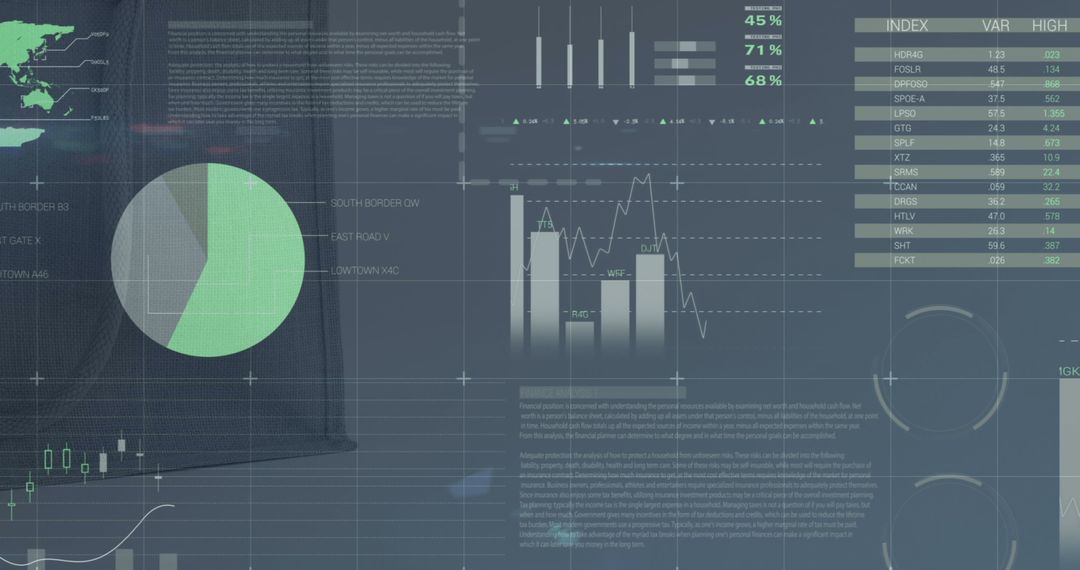
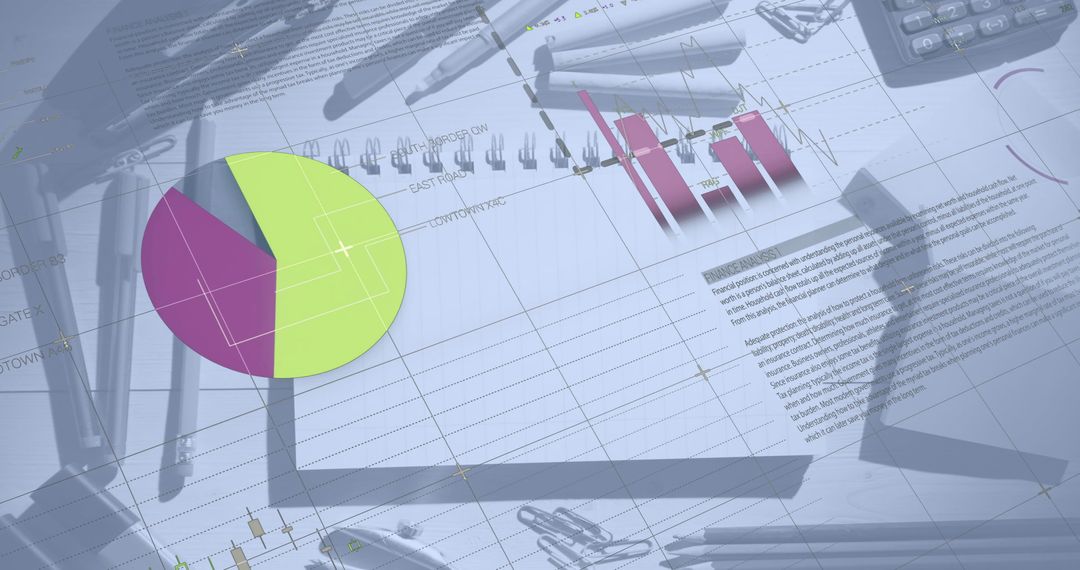
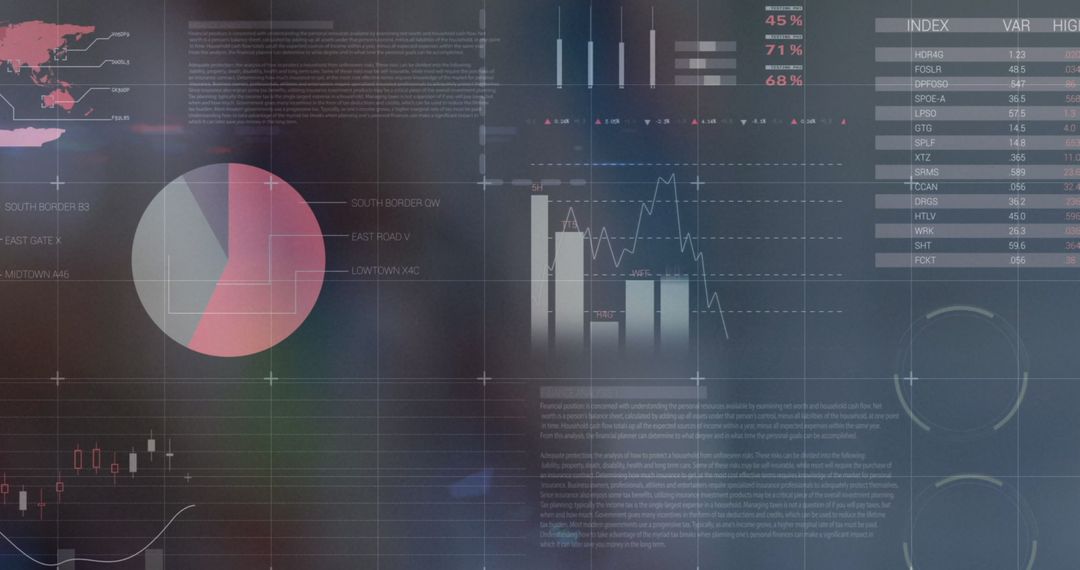
- Digital Financial Data Analysis on Workspace with Stationery
Digital Financial Data Analysis on Workspace with Stationery Image
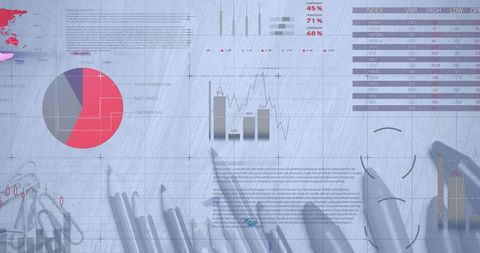
Finely integrated graphic displaying intricate financial data superimposed over a desk full of stationery, blending traditional tools with modern digital analysis realm. Ideal for use in financial sector content, business analysis educational resources, and discussions on integrating digital and physical working environments.
Powered by  - Get 15% off with code: PIKWIZARD15


2
downloads
downloads
Tags:
More
Credit Photo
If you would like to credit the Photo, here are some ways you can do so
Text Link
photo Link
<span class="text-link">
<span>
<a target="_blank" href=https://pikwizard.com/photo/digital-financial-data-analysis-on-workspace-with-stationery/e55f513d3167b42702aa9bc5ceb7528e/>PikWizard</a>
</span>
</span>
<span class="image-link">
<span
style="margin: 0 0 20px 0; display: inline-block; vertical-align: middle; width: 100%;"
>
<a
target="_blank"
href="https://pikwizard.com/photo/digital-financial-data-analysis-on-workspace-with-stationery/e55f513d3167b42702aa9bc5ceb7528e/"
style="text-decoration: none; font-size: 10px; margin: 0;"
>
<img src="https://pikwizard.com/pw/medium/e55f513d3167b42702aa9bc5ceb7528e.jpg" style="margin: 0; width: 100%;" alt="" />
<p style="font-size: 12px; margin: 0;">PikWizard</p>
</a>
</span>
</span>
Free (free of charge)
Free for personal and commercial use.
Author: Creative Art
Similar Free Stock Images

Premium


Premium


Premium


Premium


Premium


Premium


Premium


Premium


Premium


Premium


Premium


Premium


Premium


Premium


Premium


Premium


Premium


Premium


Premium


Premium


Premium


Premium


Premium


Premium