
- Home >
- Stock Photos >
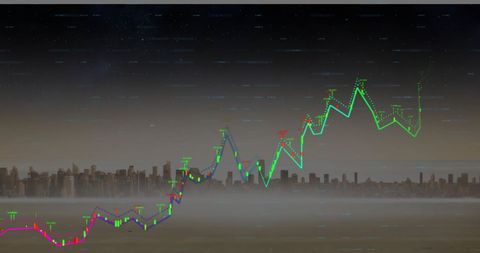
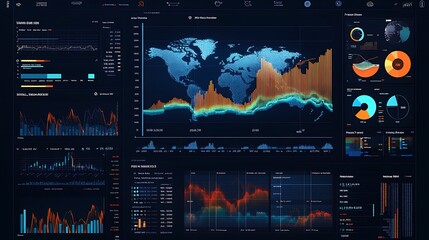
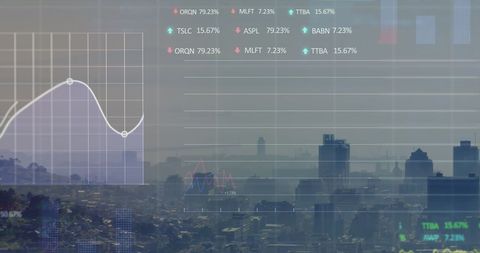
- Digital Financial Data Analysis Over Cityscape Background
Digital Financial Data Analysis Over Cityscape Background Image

Scene uses virtual city overlay with dynamic charts for modern finance story, presentations, publications in trading, Tech graphics symbolize high-stakes decision making in global markets for analytical platform mills story.
Powered by 


downloads
Tags:
More
Credit Photo
If you would like to credit the Photo, here are some ways you can do so
Text Link
photo Link
<span class="text-link">
<span>
<a target="_blank" href=https://pikwizard.com/photo/digital-financial-data-analysis-over-cityscape-background/7fe0762adbe5eb542aec1fc3ddeeda6a/>PikWizard</a>
</span>
</span>
<span class="image-link">
<span
style="margin: 0 0 20px 0; display: inline-block; vertical-align: middle; width: 100%;"
>
<a
target="_blank"
href="https://pikwizard.com/photo/digital-financial-data-analysis-over-cityscape-background/7fe0762adbe5eb542aec1fc3ddeeda6a/"
style="text-decoration: none; font-size: 10px; margin: 0;"
>
<img src="https://pikwizard.com/pw/medium/7fe0762adbe5eb542aec1fc3ddeeda6a.jpg" style="margin: 0; width: 100%;" alt="" />
<p style="font-size: 12px; margin: 0;">PikWizard</p>
</a>
</span>
</span>
Free (free of charge)
Free for personal and commercial use.
Author: Awesome Content
Similar Free Stock Images

Premium

Premium

Premium


Premium


Premium

Premium

Premium

Premium


Premium


Premium


Premium


Premium

Premium

Premium


Premium


Premium

Premium


Premium


Premium


Premium


Premium


Premium


Premium


Premium


Premium

Explore More Free Stock Images