- Home >
- Stock Photos >
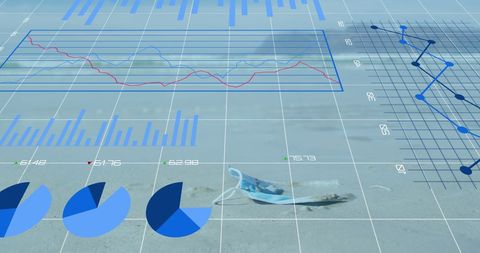
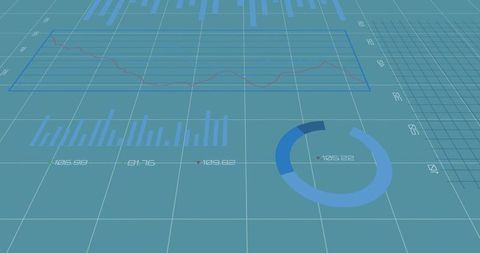
- Digital Financial Data Analysis Overlaid on Dark Grid Background
Digital Financial Data Analysis Overlaid on Dark Grid Background Image

Visual presents financial data analysis as blue lines overlay a grid, illustrating global business and data processing concepts. Relevant to financial technology, big data visualization, statistical analysis marketing materials, tech blogs, and investment-related platforms.
Powered by  - Get 15% off with code: PIKWIZARD15


2
downloads
downloads
Tags:
More
Credit Photo
If you would like to credit the Photo, here are some ways you can do so
Text Link
photo Link
<span class="text-link">
<span>
<a target="_blank" href=https://pikwizard.com/photo/digital-financial-data-analysis-overlaid-on-dark-grid-background/7307ccc170b563198af2e117266033b2/>PikWizard</a>
</span>
</span>
<span class="image-link">
<span
style="margin: 0 0 20px 0; display: inline-block; vertical-align: middle; width: 100%;"
>
<a
target="_blank"
href="https://pikwizard.com/photo/digital-financial-data-analysis-overlaid-on-dark-grid-background/7307ccc170b563198af2e117266033b2/"
style="text-decoration: none; font-size: 10px; margin: 0;"
>
<img src="https://pikwizard.com/pw/medium/7307ccc170b563198af2e117266033b2.jpg" style="margin: 0; width: 100%;" alt="" />
<p style="font-size: 12px; margin: 0;">PikWizard</p>
</a>
</span>
</span>
Free (free of charge)
Free for personal and commercial use.
Author: People Creations
Similar Free Stock Images

Premium


Premium


Premium


Premium


Premium


Premium


Premium


Premium


Premium


Premium


Premium


Premium


Premium


Premium


Premium


Premium


Premium


Premium


Premium


Premium


Premium


Premium


Premium


Premium


Premium