
- Home >
- Stock Photos >
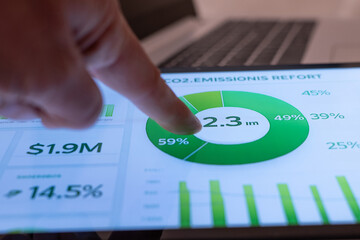
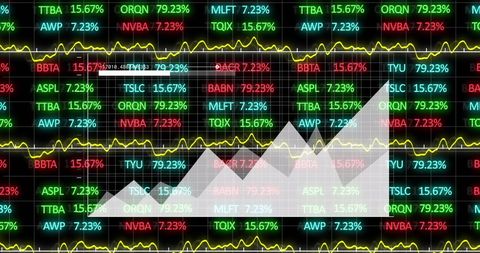
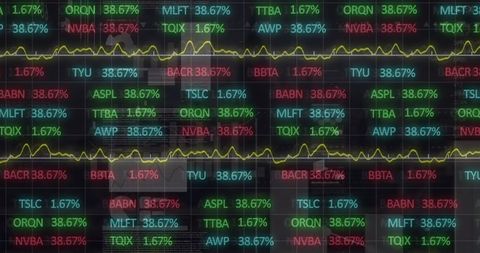
- Digital Financial Data Analysis Screen Display with Graphs
Digital Financial Data Analysis Screen Display with Graphs Image
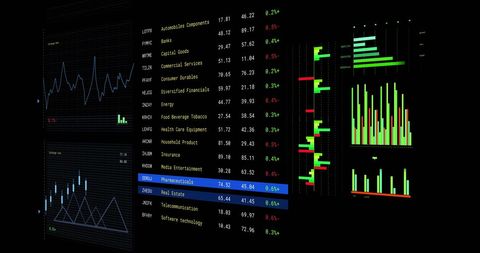
Illustration shows digital screen filled with financial data and graphs highlighting business and finance sectors. Ideal for presentations, articles, and educational content on global financial markets, data analysis, or technological advancements in finances.
Powered by 


downloads
Tags:
More
Credit Photo
If you would like to credit the Photo, here are some ways you can do so
Text Link
photo Link
<span class="text-link">
<span>
<a target="_blank" href=https://pikwizard.com/photo/digital-financial-data-analysis-screen-display-with-graphs/078649b7869cce694fa6f62f6dda00ec/>PikWizard</a>
</span>
</span>
<span class="image-link">
<span
style="margin: 0 0 20px 0; display: inline-block; vertical-align: middle; width: 100%;"
>
<a
target="_blank"
href="https://pikwizard.com/photo/digital-financial-data-analysis-screen-display-with-graphs/078649b7869cce694fa6f62f6dda00ec/"
style="text-decoration: none; font-size: 10px; margin: 0;"
>
<img src="https://pikwizard.com/pw/medium/078649b7869cce694fa6f62f6dda00ec.jpg" style="margin: 0; width: 100%;" alt="" />
<p style="font-size: 12px; margin: 0;">PikWizard</p>
</a>
</span>
</span>
Free (free of charge)
Free for personal and commercial use.
Author: Creative Art
Similar Free Stock Images

Premium


Premium


Premium

Premium


Premium


Premium


Premium


Premium


Premium


Premium


Premium


Premium


Premium


Premium


Premium


Premium


Premium


Premium


Premium


Premium

Premium


Premium


Premium

Premium


Premium


Explore More Free Stock Images