
- Home >
- Stock Photos >
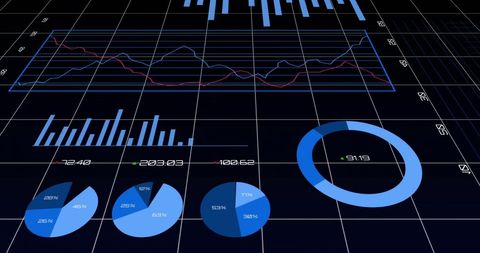
- Digital Financial Data Analysis Visualization with Charts
Digital Financial Data Analysis Visualization with Charts Image

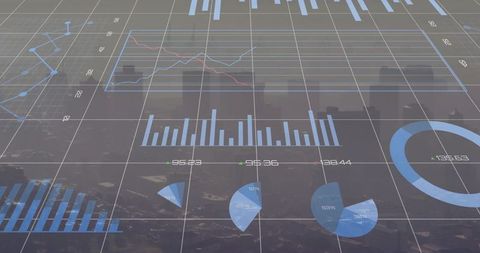
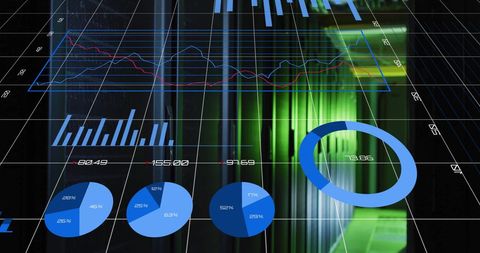
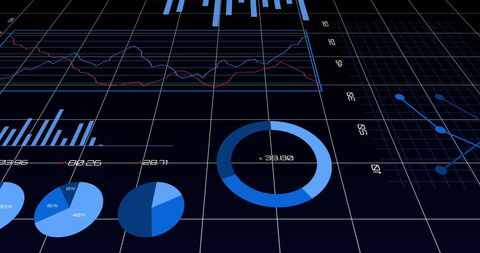
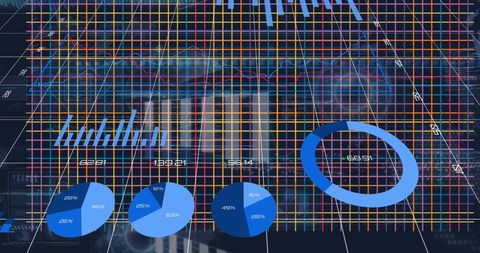
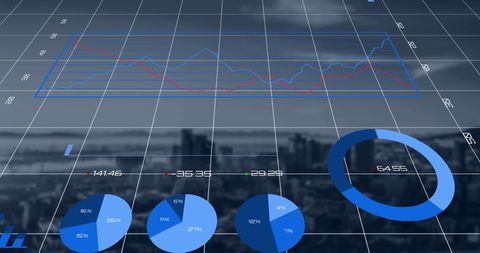
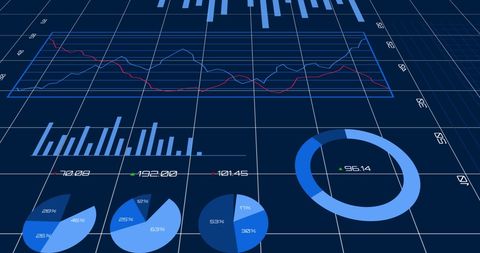
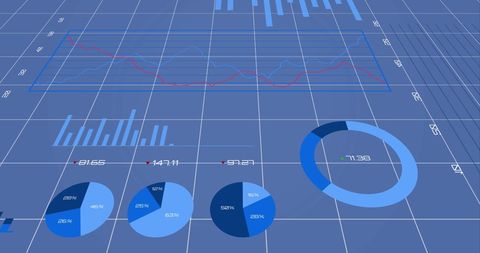
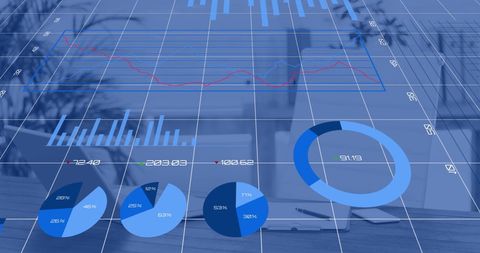
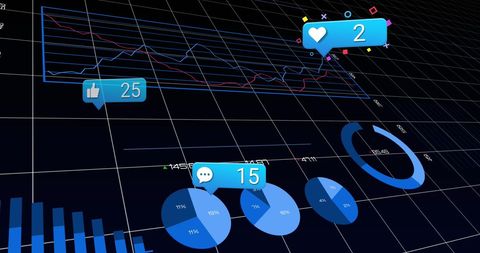
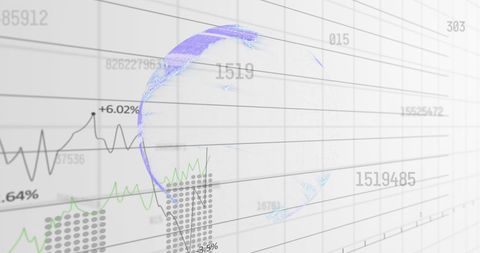
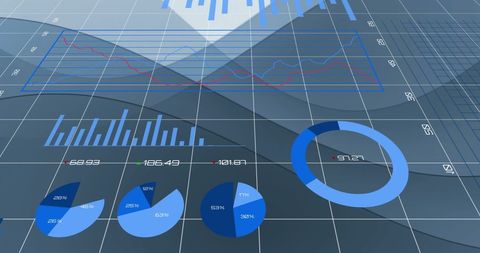
This stock photo features a comprehensive digital interface illustrating various financial data points, including graphs and pie charts over a grid background. Ideal for use in presentations, financial reports, and economic analyses. It effectively communicates concepts of business intelligence, data science, or financial market studies.
Powered by 


downloads
Tags:
More
Credit Photo
If you would like to credit the Photo, here are some ways you can do so
Text Link
photo Link
<span class="text-link">
<span>
<a target="_blank" href=https://pikwizard.com/photo/digital-financial-data-analysis-visualization-with-charts/00c431ed738552c77b7bec43888a4a4a/>PikWizard</a>
</span>
</span>
<span class="image-link">
<span
style="margin: 0 0 20px 0; display: inline-block; vertical-align: middle; width: 100%;"
>
<a
target="_blank"
href="https://pikwizard.com/photo/digital-financial-data-analysis-visualization-with-charts/00c431ed738552c77b7bec43888a4a4a/"
style="text-decoration: none; font-size: 10px; margin: 0;"
>
<img src="https://pikwizard.com/pw/medium/00c431ed738552c77b7bec43888a4a4a.jpg" style="margin: 0; width: 100%;" alt="" />
<p style="font-size: 12px; margin: 0;">PikWizard</p>
</a>
</span>
</span>
Free (free of charge)
Free for personal and commercial use.
Author: Authentic Images
Similar Free Stock Images

Premium


Premium


Premium

Premium


Premium


Premium


Premium


Premium


Premium


Premium


Premium


Premium


Premium


Premium


Premium

Premium


Premium


Premium


Premium


Premium


Premium


Premium


Premium

Premium

Premium


Explore More Free Stock Images