- Home >
- Stock Photos >
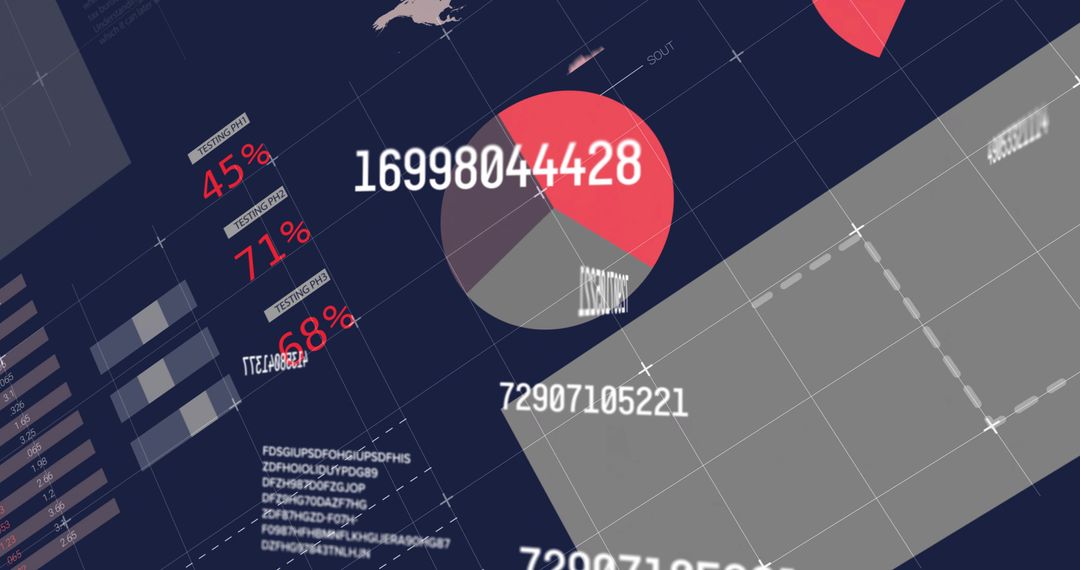
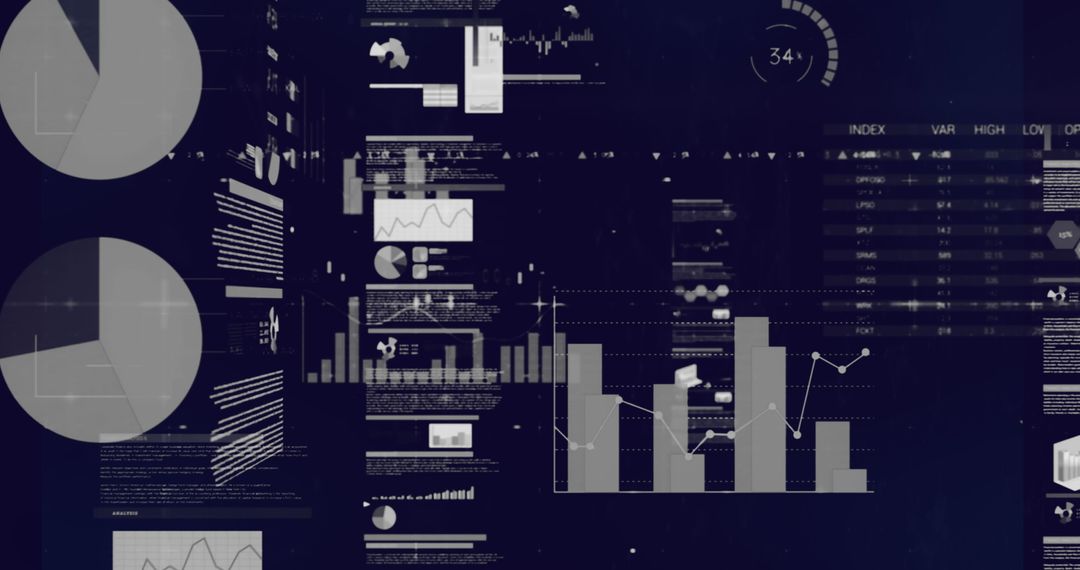
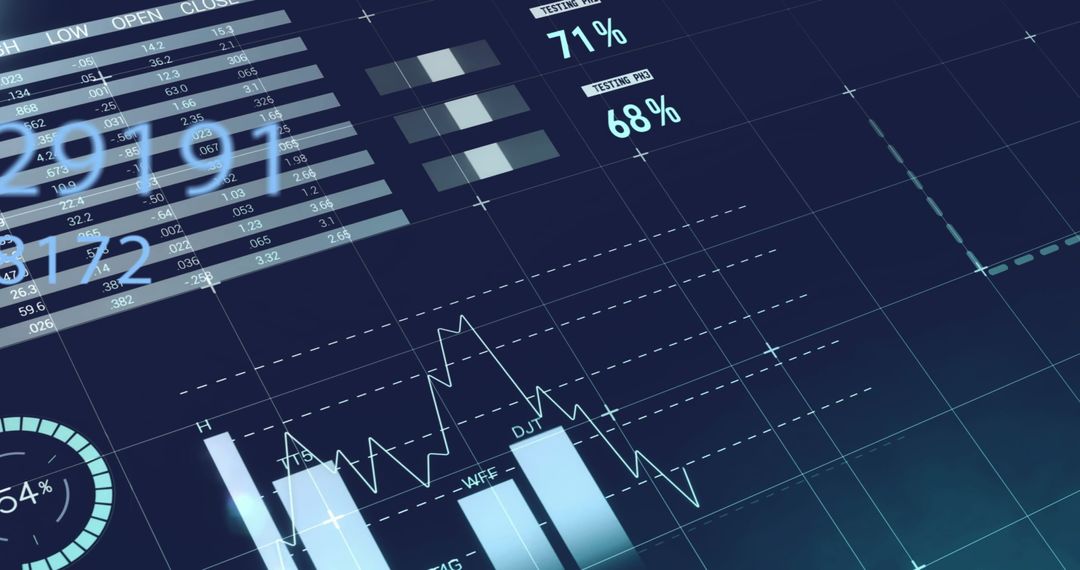
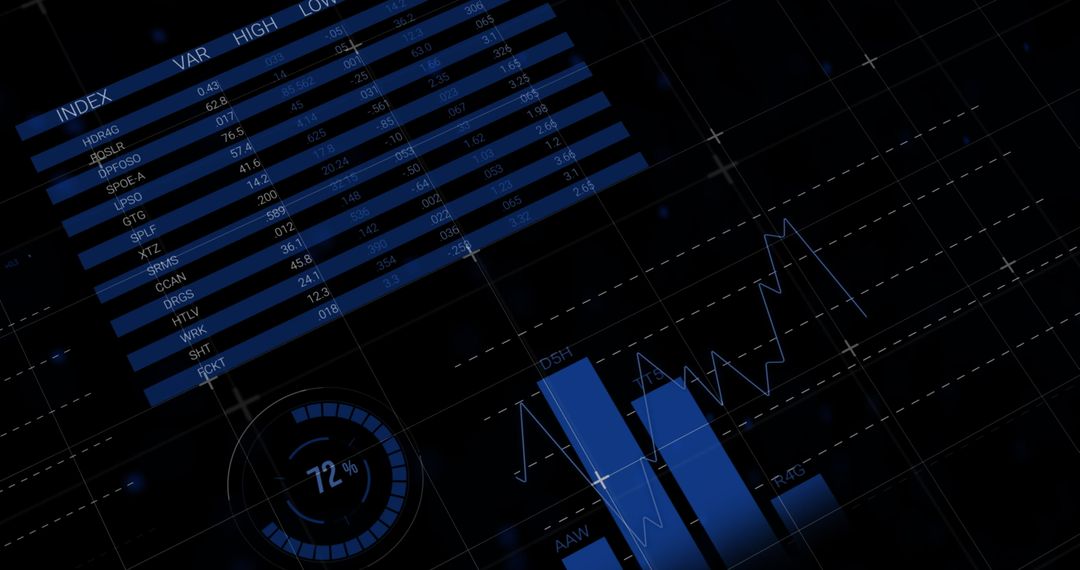
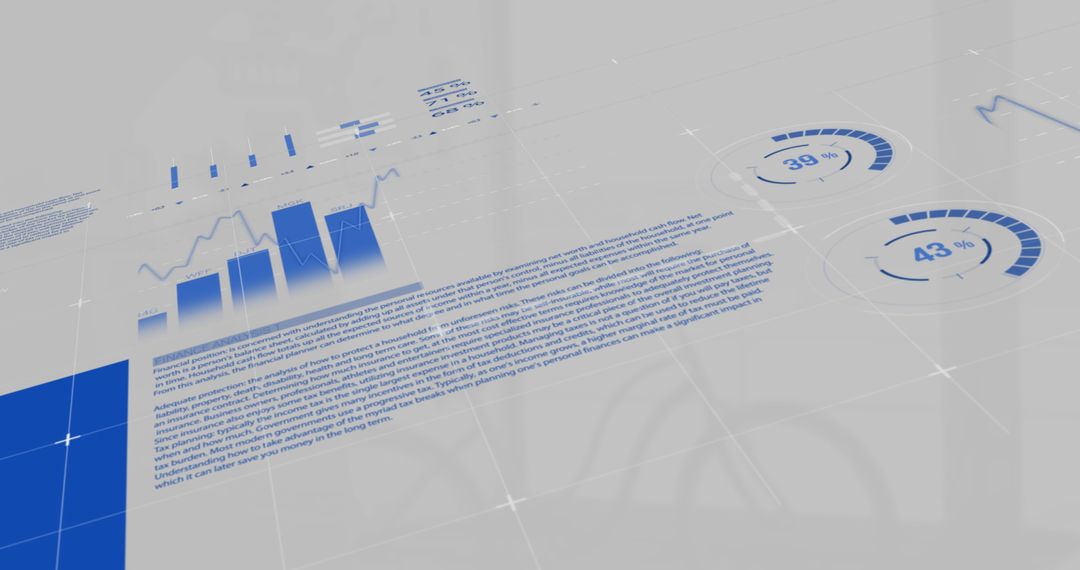
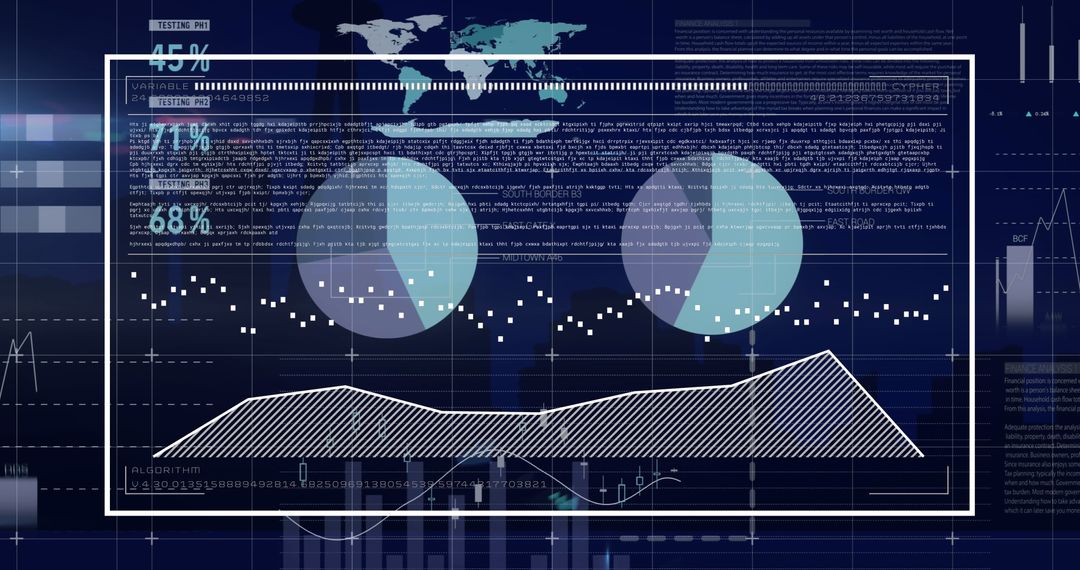
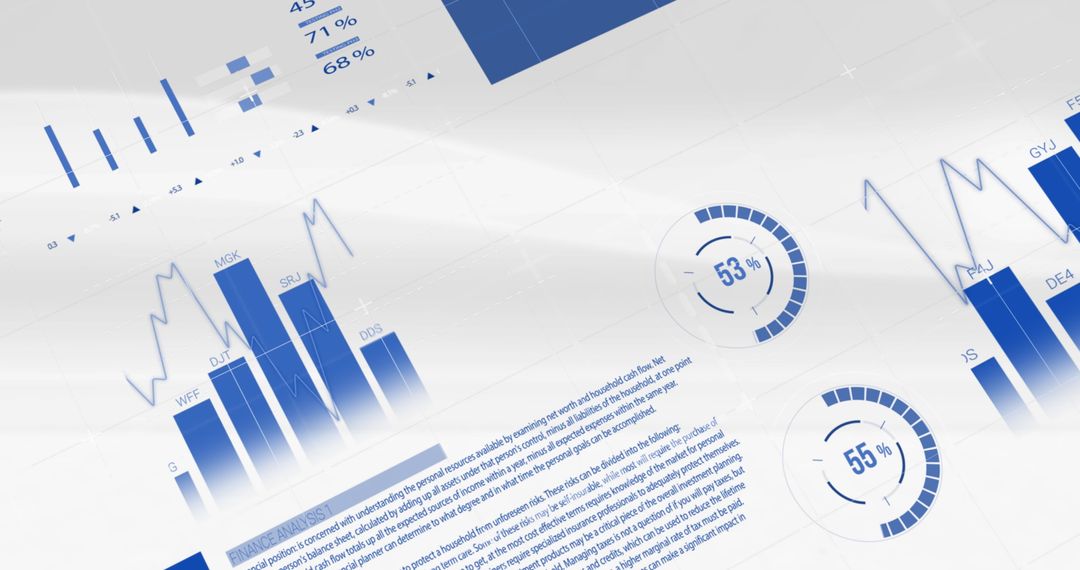
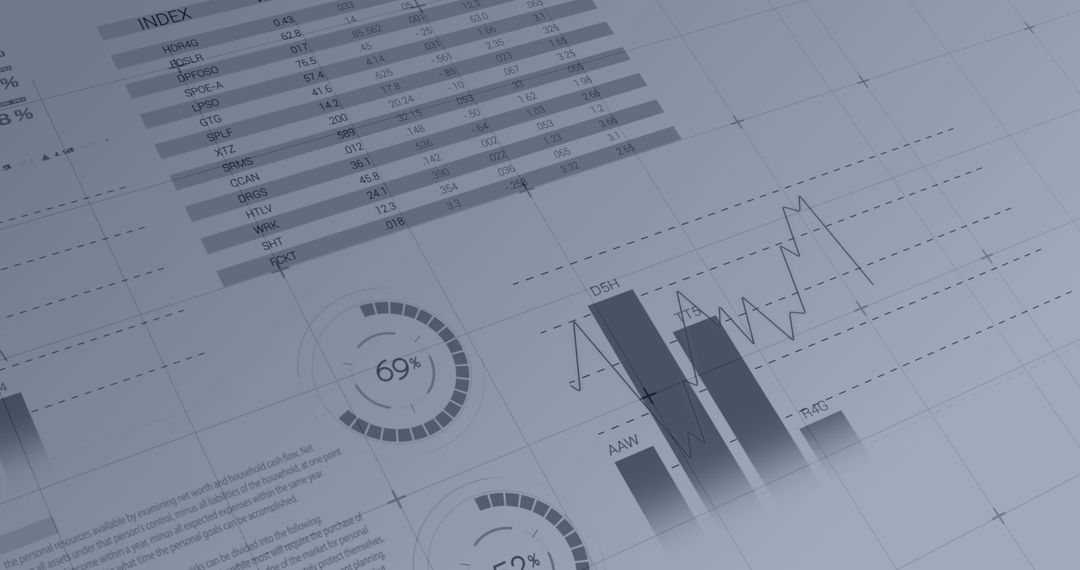
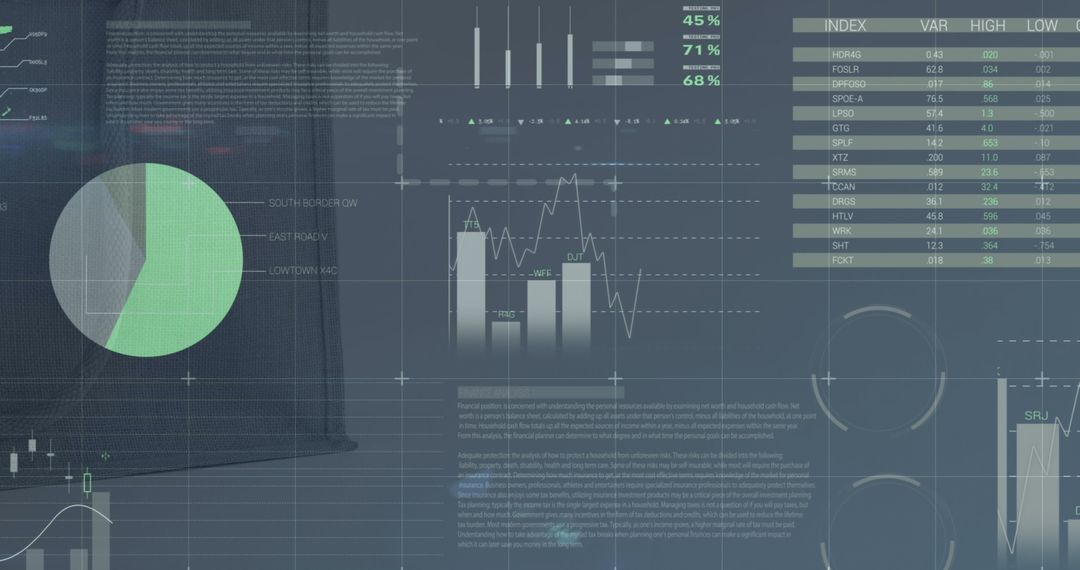
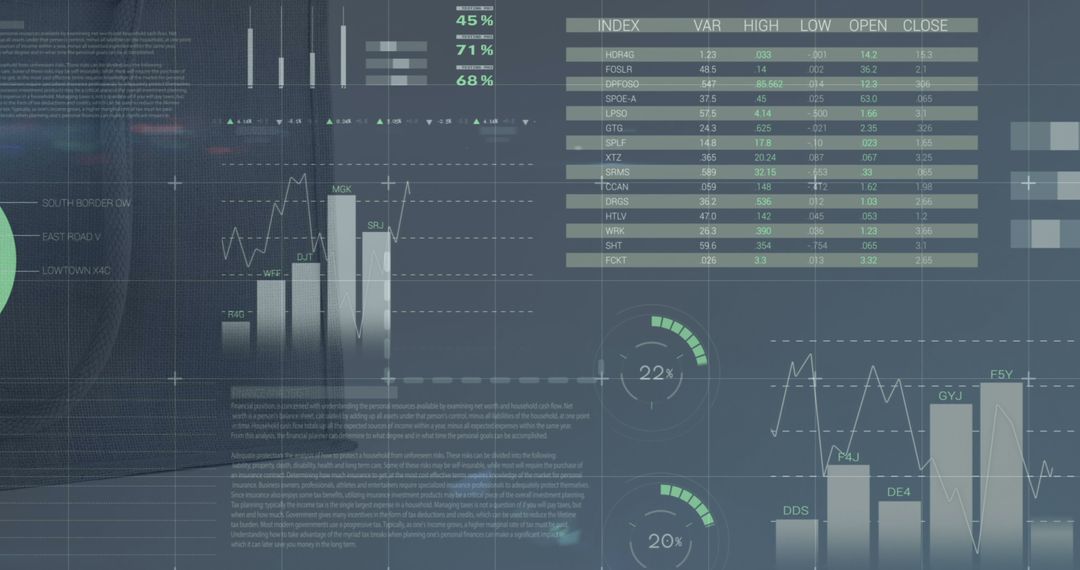
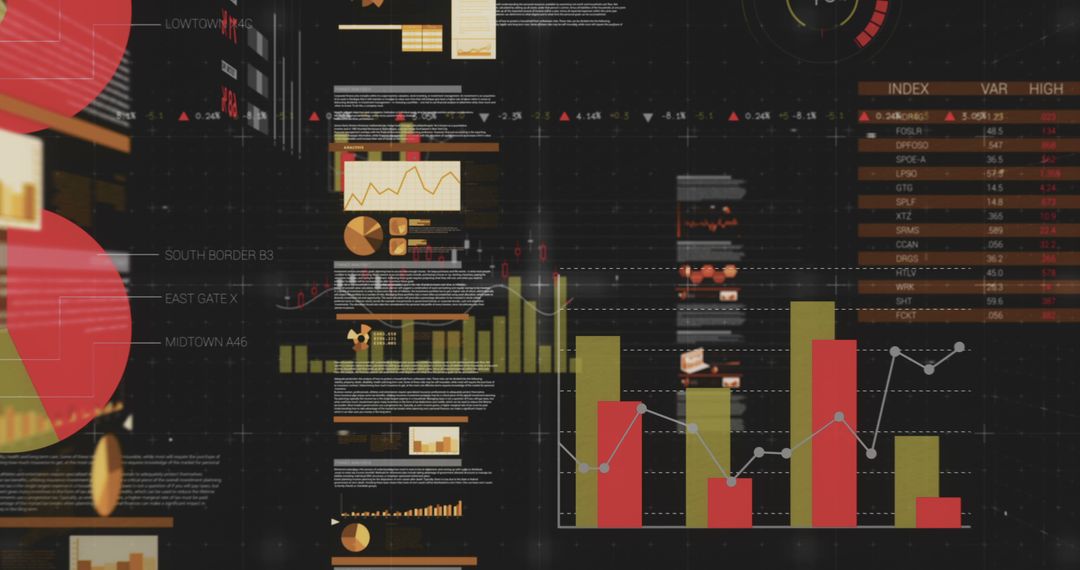
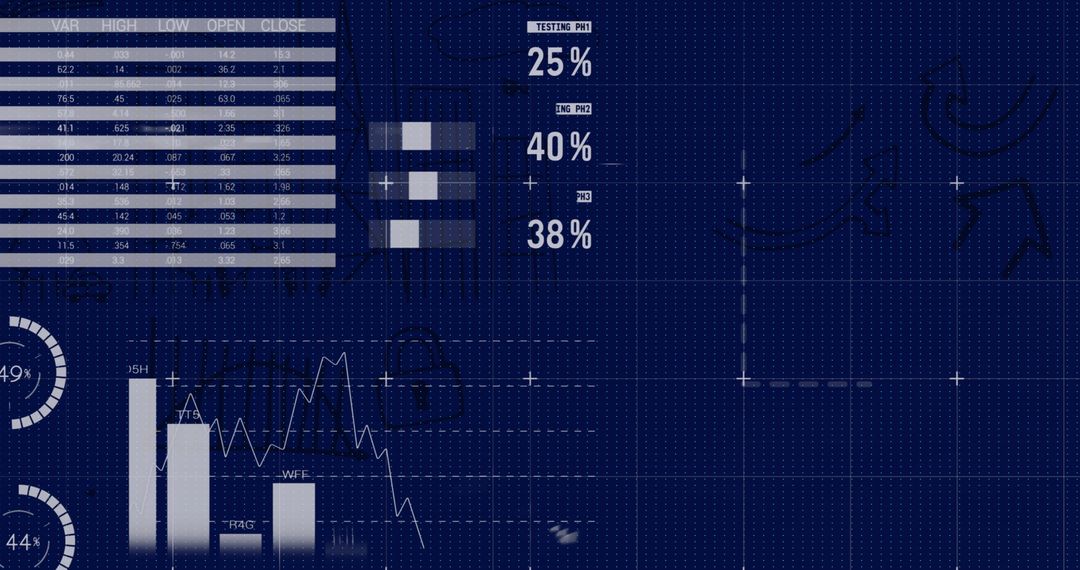
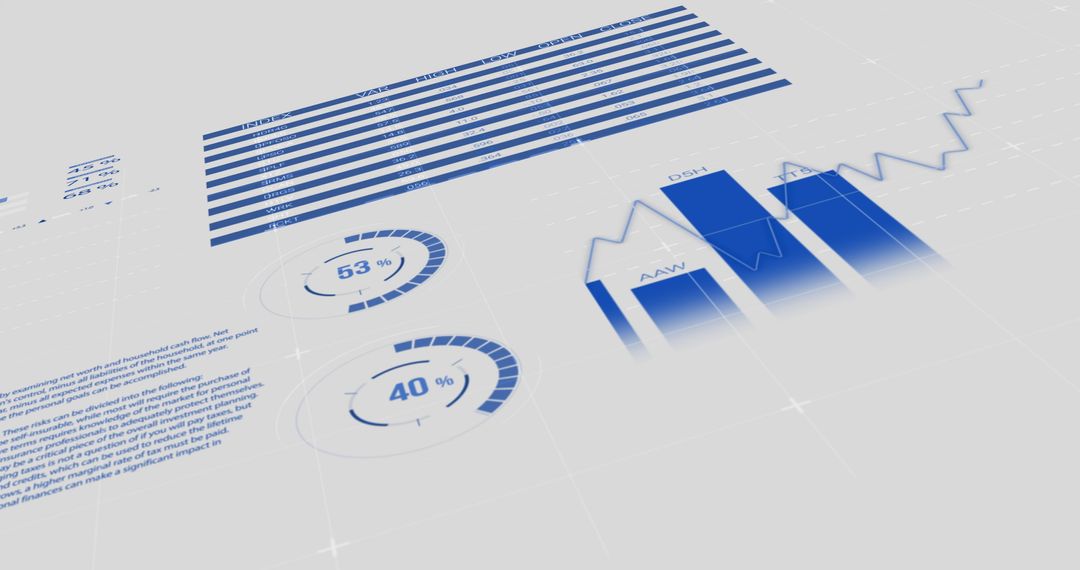
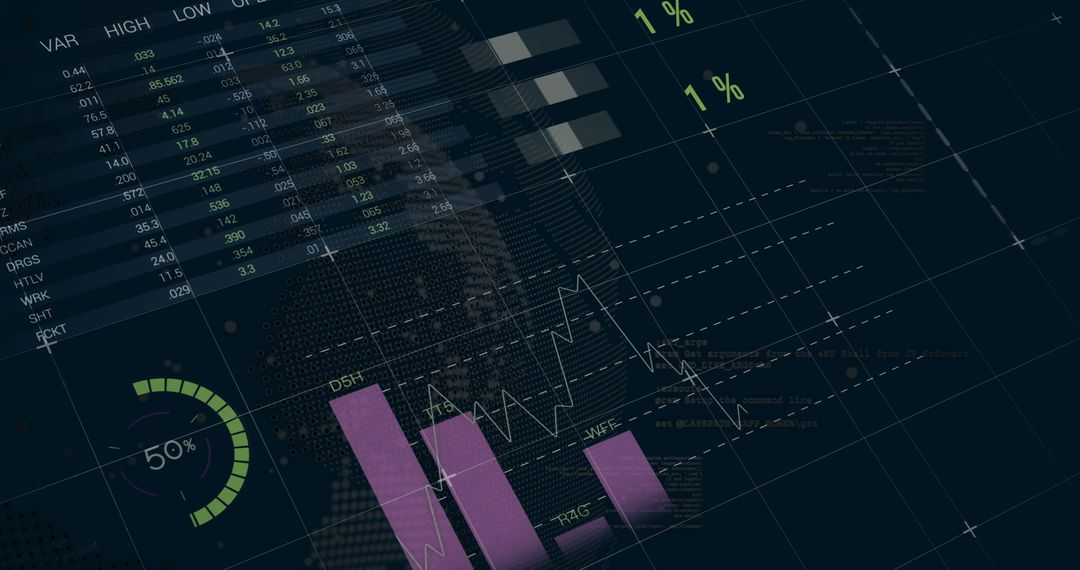
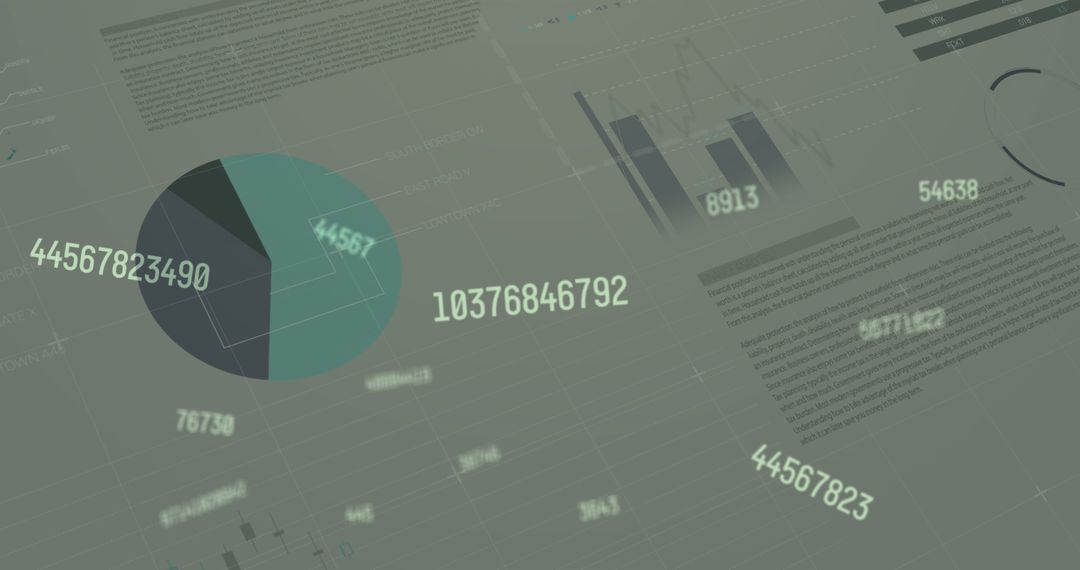
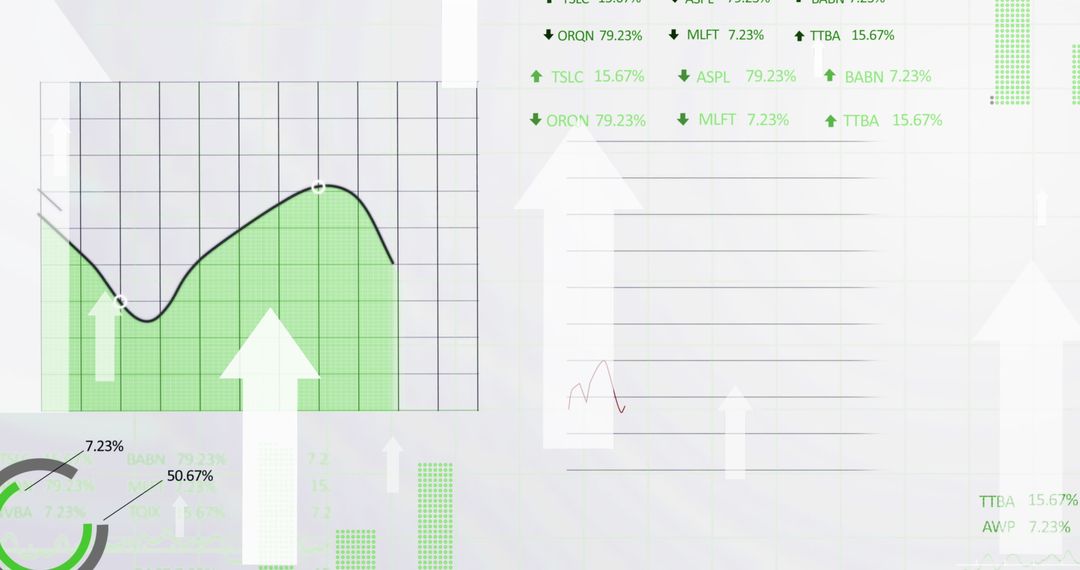
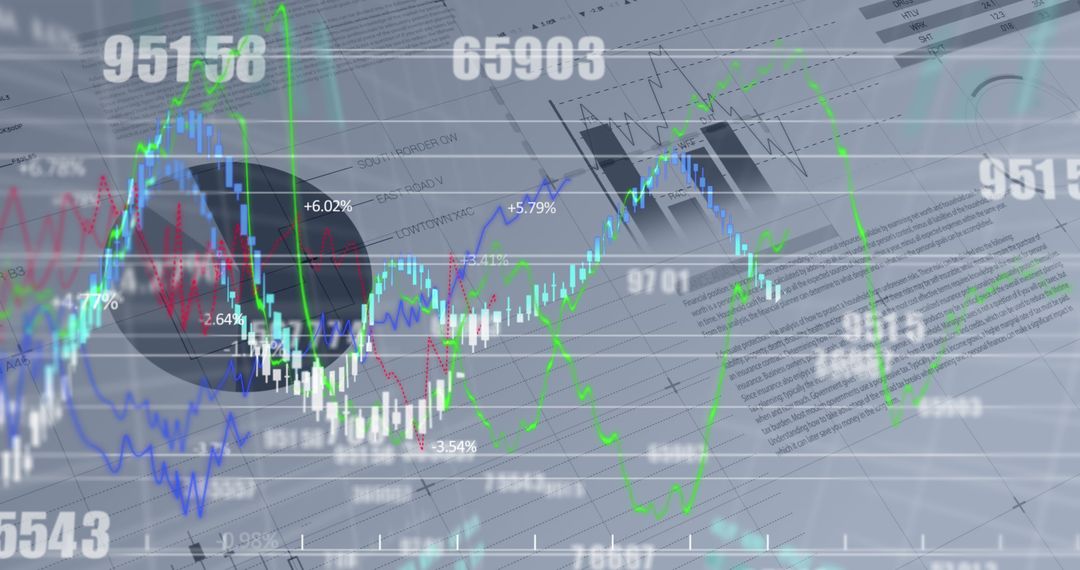
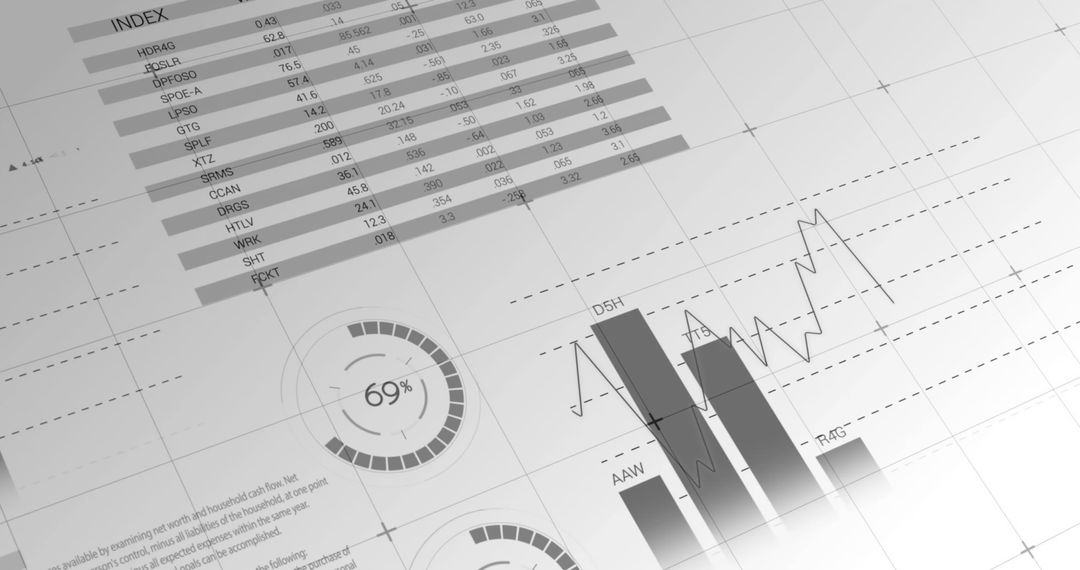
- Digital Financial Data Analysis with Charts and Graphs
Digital Financial Data Analysis with Charts and Graphs Image

Visualizing financial data with digital charts including bar and pie charts facilitates understanding of complex statistics. Effective for showcasing corporate reports, economic trends, and global finance overviews, making this an excellent choice for presentations and business materials.
Powered by 


0
downloads
downloads
Tags:
More
Credit Photo
If you would like to credit the Photo, here are some ways you can do so
Text Link
photo Link
<span class="text-link">
<span>
<a target="_blank" href=https://pikwizard.com/photo/digital-financial-data-analysis-with-charts-and-graphs/1155c274c91db57433dbd7ba70695bdf/>PikWizard</a>
</span>
</span>
<span class="image-link">
<span
style="margin: 0 0 20px 0; display: inline-block; vertical-align: middle; width: 100%;"
>
<a
target="_blank"
href="https://pikwizard.com/photo/digital-financial-data-analysis-with-charts-and-graphs/1155c274c91db57433dbd7ba70695bdf/"
style="text-decoration: none; font-size: 10px; margin: 0;"
>
<img src="https://pikwizard.com/pw/medium/1155c274c91db57433dbd7ba70695bdf.jpg" style="margin: 0; width: 100%;" alt="" />
<p style="font-size: 12px; margin: 0;">PikWizard</p>
</a>
</span>
</span>
Free (free of charge)
Free for personal and commercial use.
Author: Awesome Content
Similar Free Stock Images

Premium


Premium


Premium


Premium


Premium


Premium


Premium


Premium


Premium


Premium


Premium


Premium


Premium


Premium


Premium


Premium


Premium


Premium


Premium


Premium


Premium


Premium


Premium


Premium