- Home >
- Stock Photos >
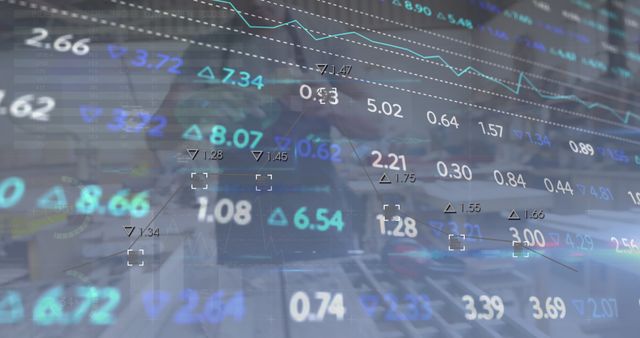
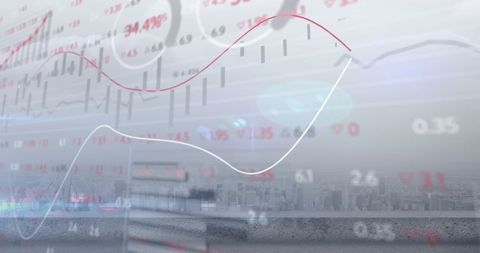
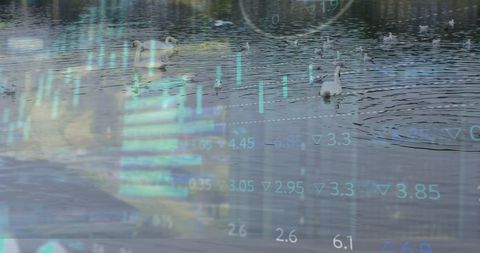
- Digital Financial Data Analysis with Graph Elements
Digital Financial Data Analysis with Graph Elements Image

Blurring lines of code over financial graphs is indicative of data processing or stock analysis operations. Suitable for depicting modern business environments, financial software tools, and economic data insights. Ideal for use in articles on finance, technology, and economic trends or as a background in presentations about the stock market.

downloads
Tags:
More
Credit Photo
If you would like to credit the Photo, here are some ways you can do so
Text Link
photo Link
<span class="text-link">
<span>
<a target="_blank" href=https://pikwizard.com/photo/digital-financial-data-analysis-with-graph-elements/a09f543293417cf17d8faa6ee5f321ea/>PikWizard</a>
</span>
</span>
<span class="image-link">
<span
style="margin: 0 0 20px 0; display: inline-block; vertical-align: middle; width: 100%;"
>
<a
target="_blank"
href="https://pikwizard.com/photo/digital-financial-data-analysis-with-graph-elements/a09f543293417cf17d8faa6ee5f321ea/"
style="text-decoration: none; font-size: 10px; margin: 0;"
>
<img src="https://pikwizard.com/pw/medium/a09f543293417cf17d8faa6ee5f321ea.jpg" style="margin: 0; width: 100%;" alt="" />
<p style="font-size: 12px; margin: 0;">PikWizard</p>
</a>
</span>
</span>
Free (free of charge)
Free for personal and commercial use.
Author: People Creations