- Home >
- Stock Photos >
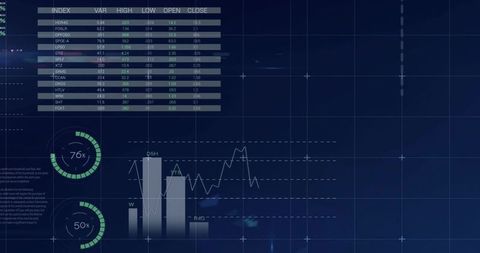
- Digital Financial Data Analysis with Graph Interface
Digital Financial Data Analysis with Graph Interface Image

Visual represents advanced digital interface showcasing financial data overlaid with graphs, potentially useful for illustrating topics related to finance, business analytics, global economy, or technology in presentations, publications, or educational materials. It effectively conveys data processing and analysis concepts.

downloads
Tags:
More
Credit Photo
If you would like to credit the Photo, here are some ways you can do so
Text Link
photo Link
<span class="text-link">
<span>
<a target="_blank" href=https://pikwizard.com/photo/digital-financial-data-analysis-with-graph-interface/41f04f399841a70420f5542c36611efb/>PikWizard</a>
</span>
</span>
<span class="image-link">
<span
style="margin: 0 0 20px 0; display: inline-block; vertical-align: middle; width: 100%;"
>
<a
target="_blank"
href="https://pikwizard.com/photo/digital-financial-data-analysis-with-graph-interface/41f04f399841a70420f5542c36611efb/"
style="text-decoration: none; font-size: 10px; margin: 0;"
>
<img src="https://pikwizard.com/pw/medium/41f04f399841a70420f5542c36611efb.jpg" style="margin: 0; width: 100%;" alt="" />
<p style="font-size: 12px; margin: 0;">PikWizard</p>
</a>
</span>
</span>
Free (free of charge)
Free for personal and commercial use.
Author: People Creations