
- Home >
- Stock Photos >
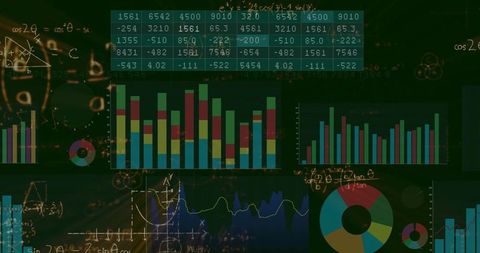
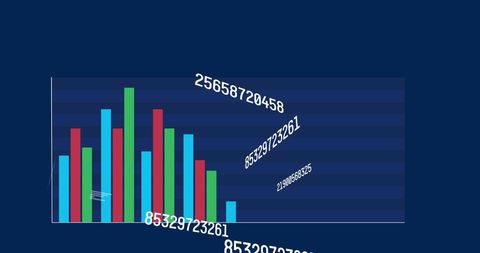
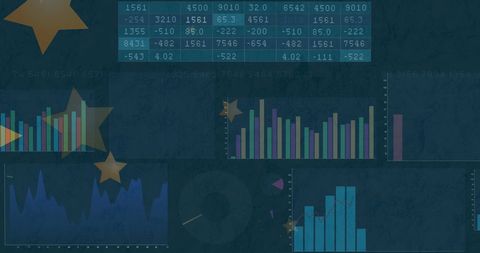
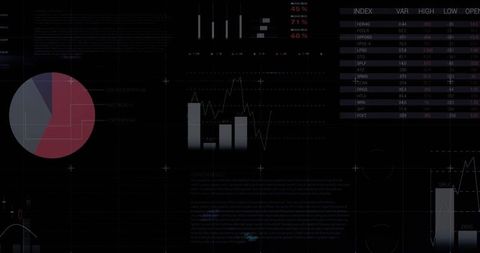
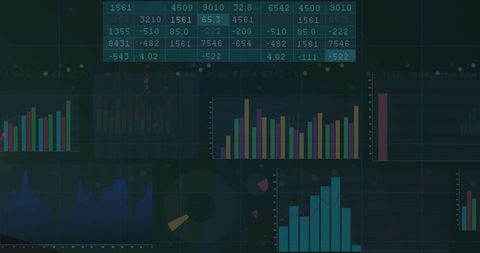
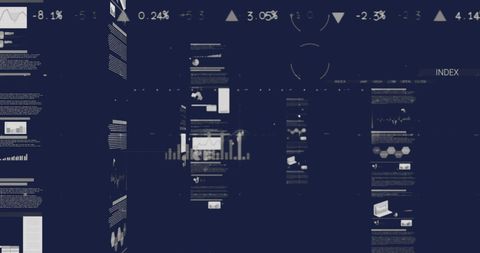
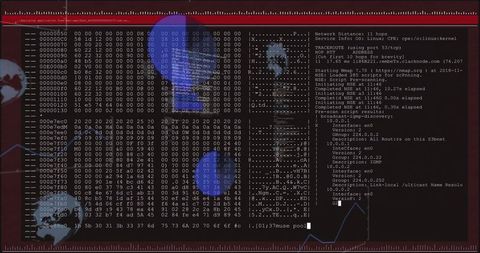
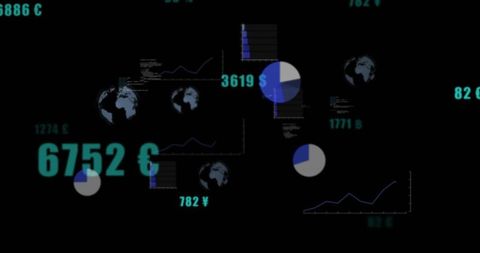
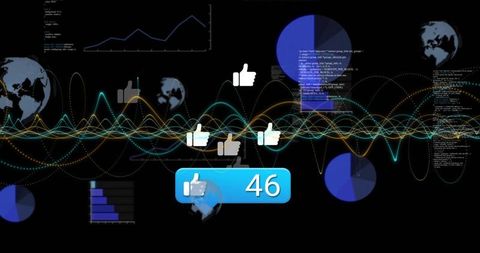
- Digital Financial Data Analysis with Graphs and Charts on Black Background
Digital Financial Data Analysis with Graphs and Charts on Black Background Image

Vibrant financial analysis depicted through colorful graphs, histograms, and solid-colored text data against a sleek black background, highlighting modern data management and business intelligence capabilities. Perfect for presentations on economic trends, seminars on business analytics, or illustrations in financial services brochures.
Powered by  - Get 15% off with code: PIKWIZARD15


2
downloads
downloads
Tags:
More
Credit Photo
If you would like to credit the Photo, here are some ways you can do so
Text Link
photo Link
<span class="text-link">
<span>
<a target="_blank" href=https://pikwizard.com/photo/digital-financial-data-analysis-with-graphs-and-charts-on-black-background/479b6c4d55b9250584ef6b456ab1638a/>PikWizard</a>
</span>
</span>
<span class="image-link">
<span
style="margin: 0 0 20px 0; display: inline-block; vertical-align: middle; width: 100%;"
>
<a
target="_blank"
href="https://pikwizard.com/photo/digital-financial-data-analysis-with-graphs-and-charts-on-black-background/479b6c4d55b9250584ef6b456ab1638a/"
style="text-decoration: none; font-size: 10px; margin: 0;"
>
<img src="https://pikwizard.com/pw/medium/479b6c4d55b9250584ef6b456ab1638a.jpg" style="margin: 0; width: 100%;" alt="" />
<p style="font-size: 12px; margin: 0;">PikWizard</p>
</a>
</span>
</span>
Free (free of charge)
Free for personal and commercial use.
Author: People Creations
Similar Free Stock Images
Premium


Premium


Premium


Premium


Premium


Premium


Premium


Premium


Premium


Premium


Premium


Premium


Premium


Premium


Premium


Premium


Premium


Premium


Premium


Premium


Premium


Premium


Premium


Premium


Premium

