
- Home >
- Stock Photos >
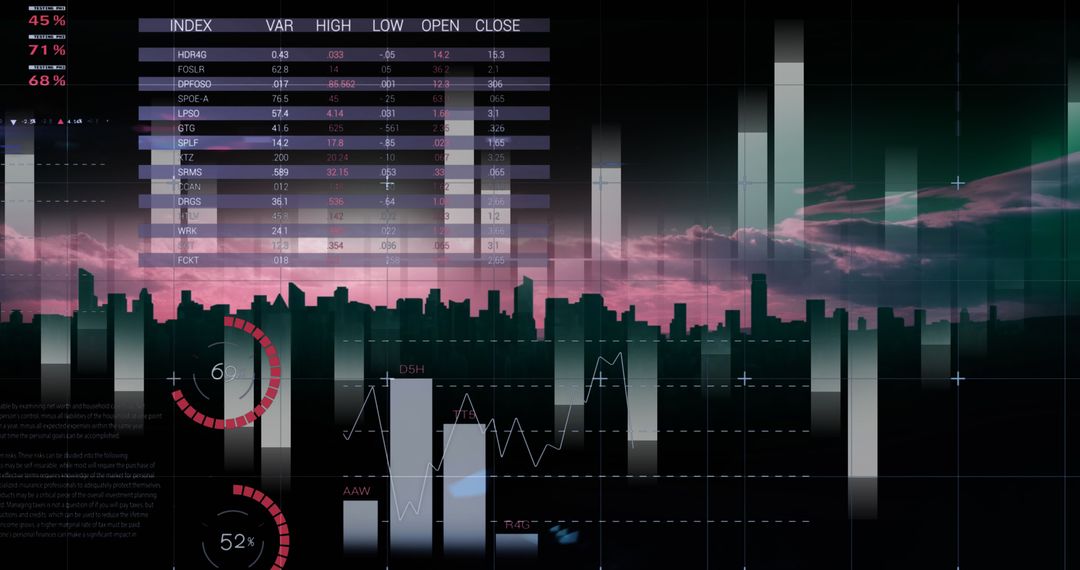
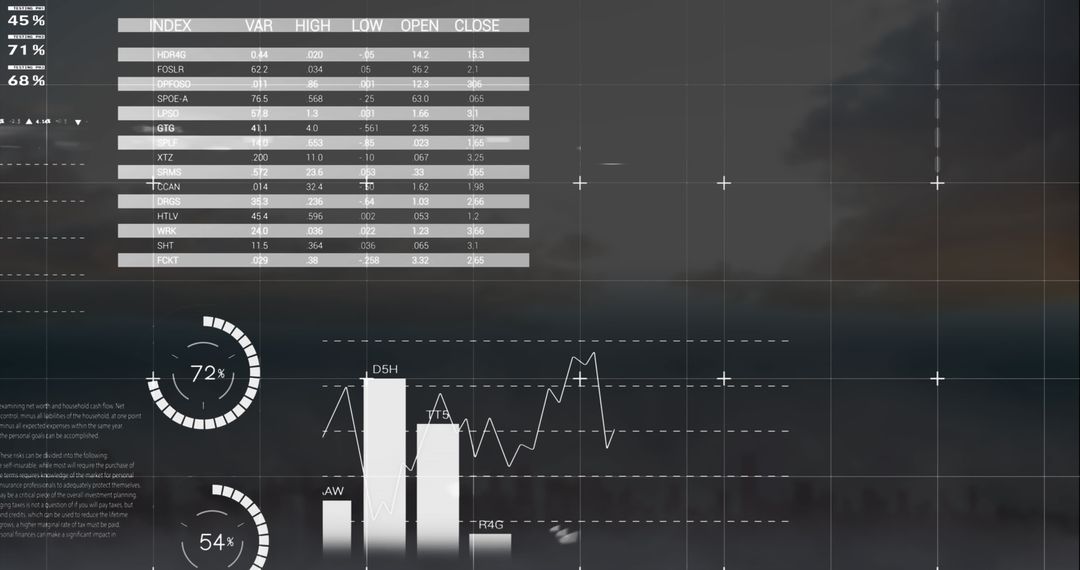
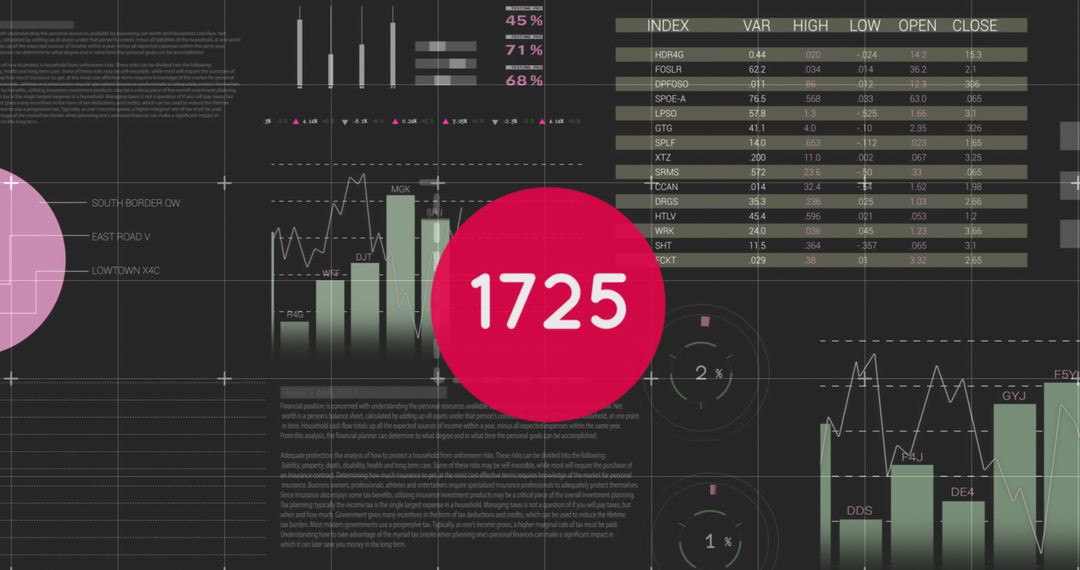
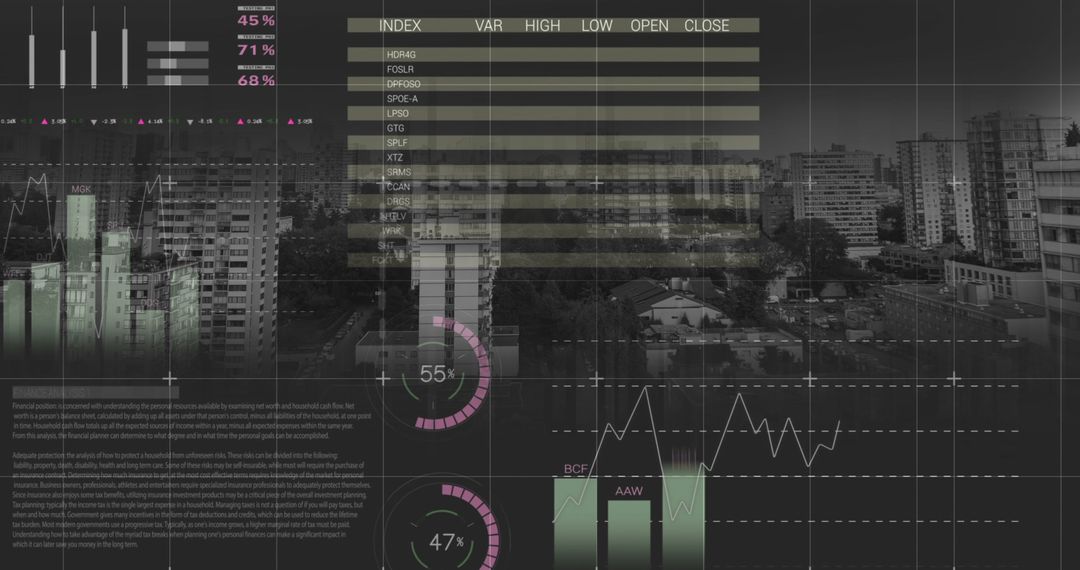
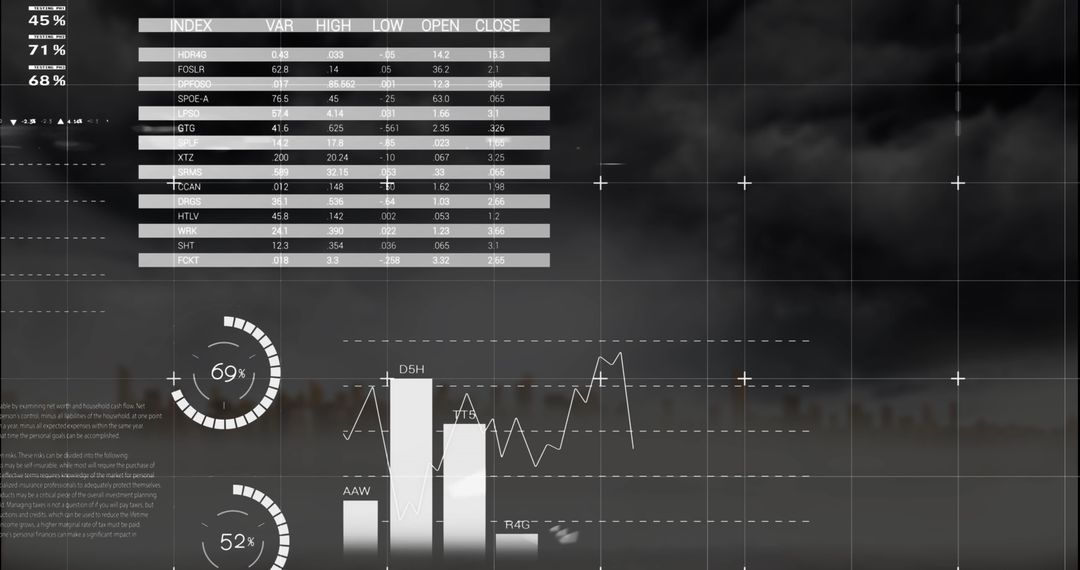
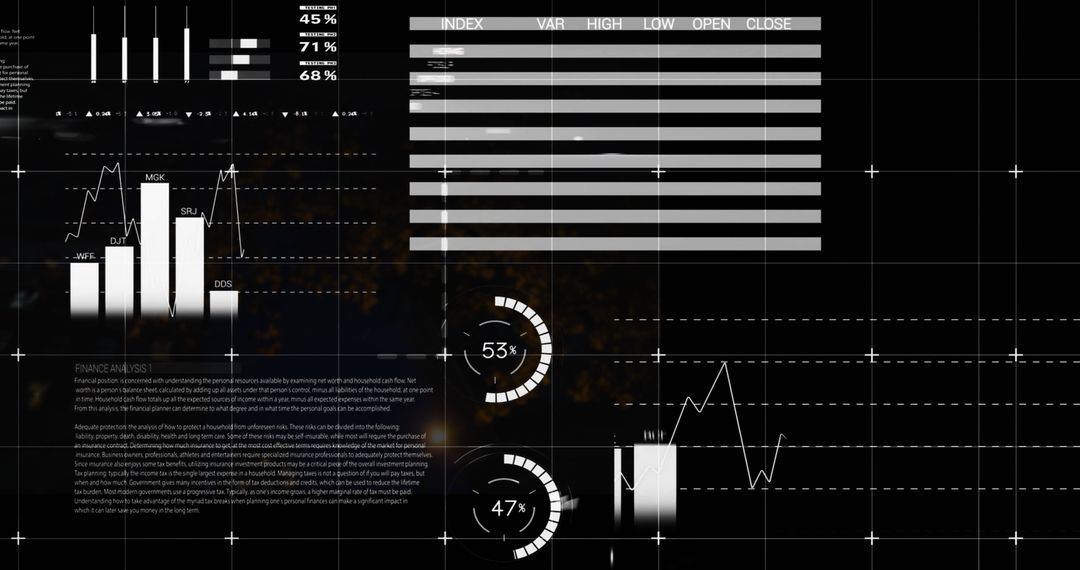
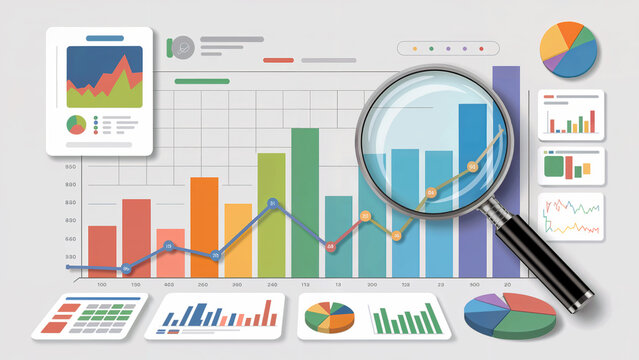
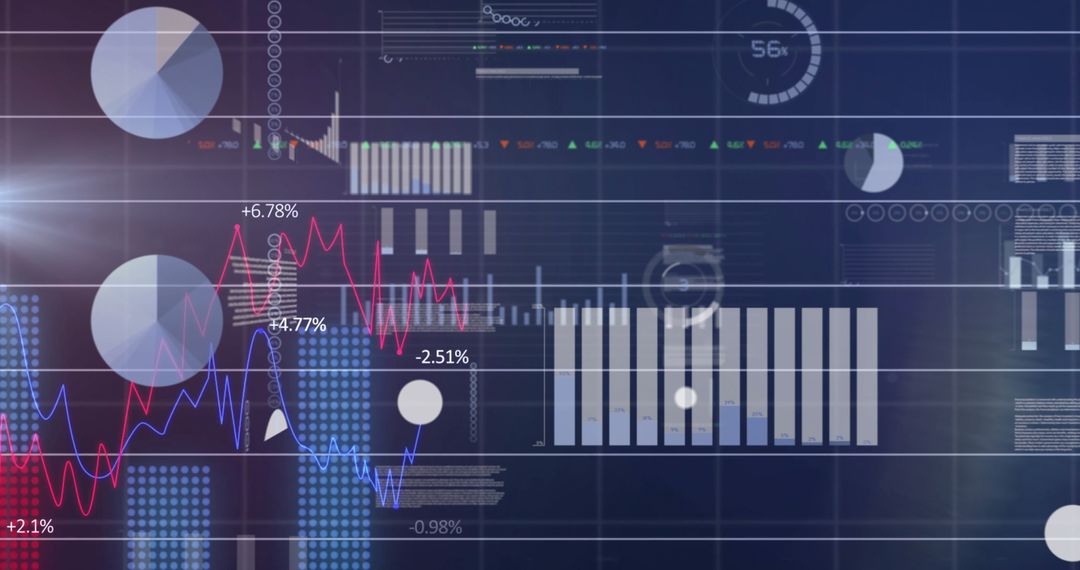
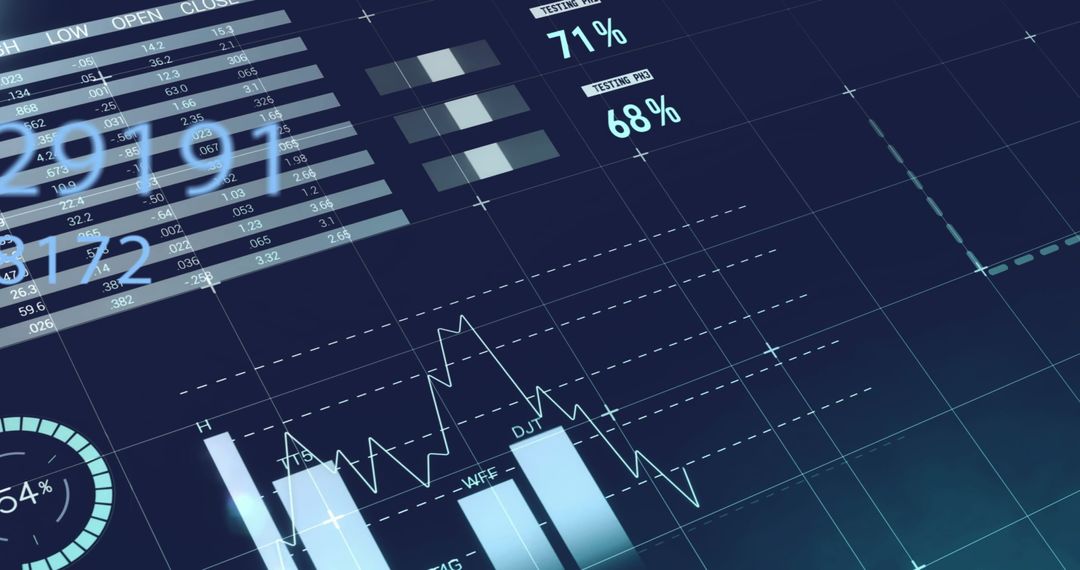
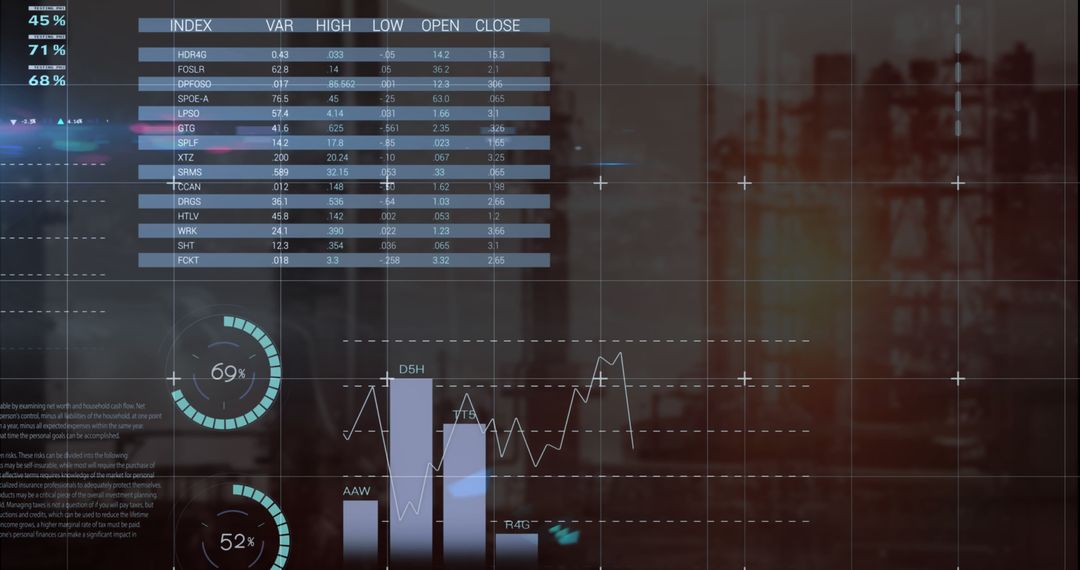
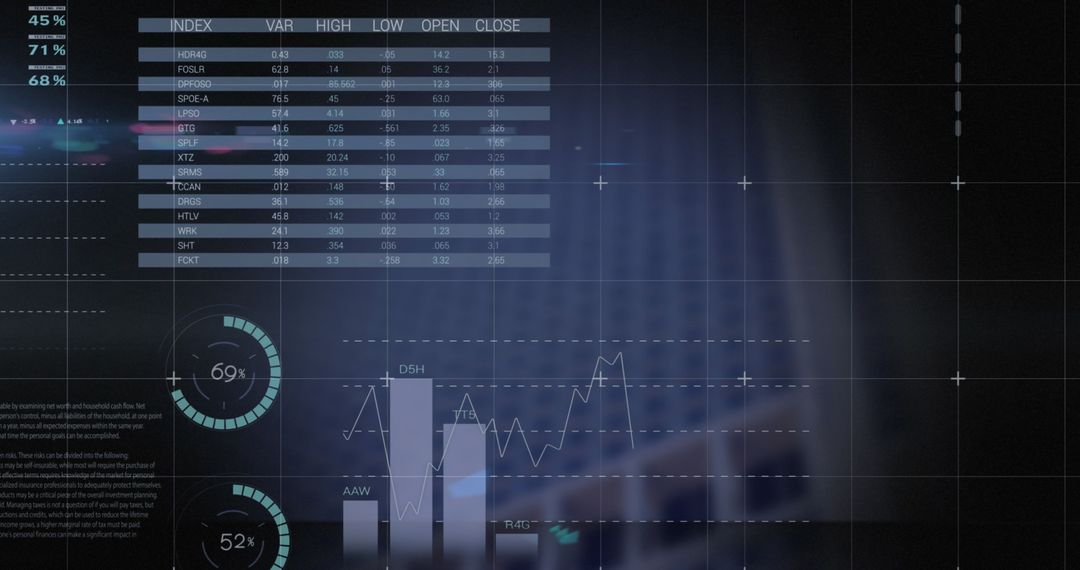
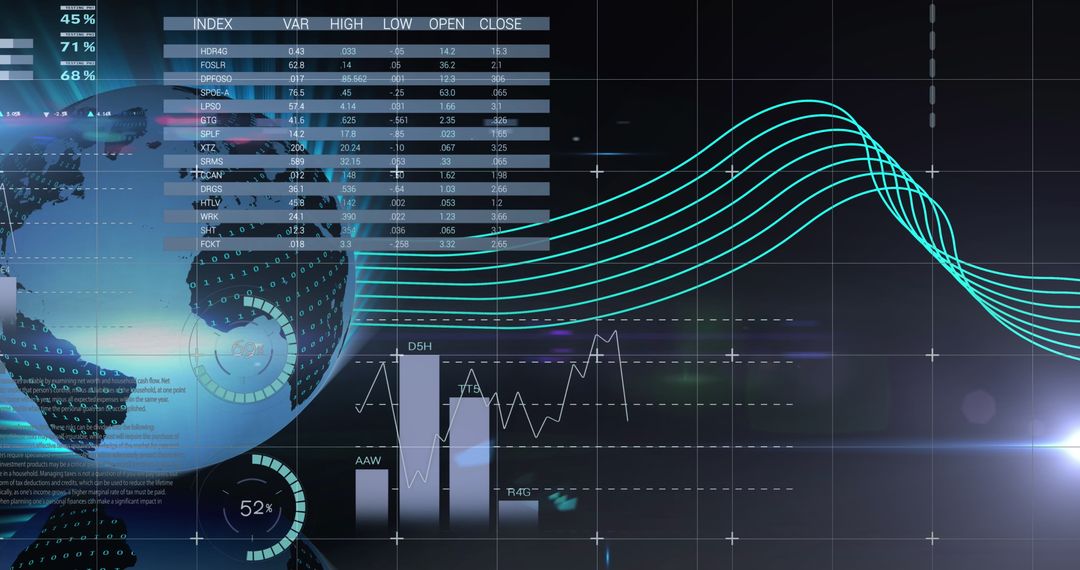
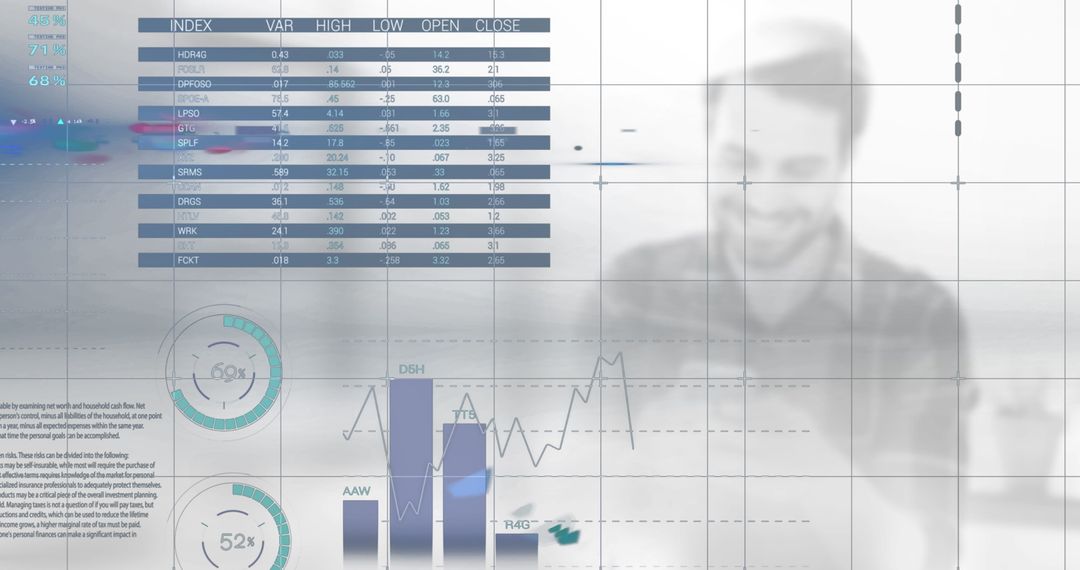
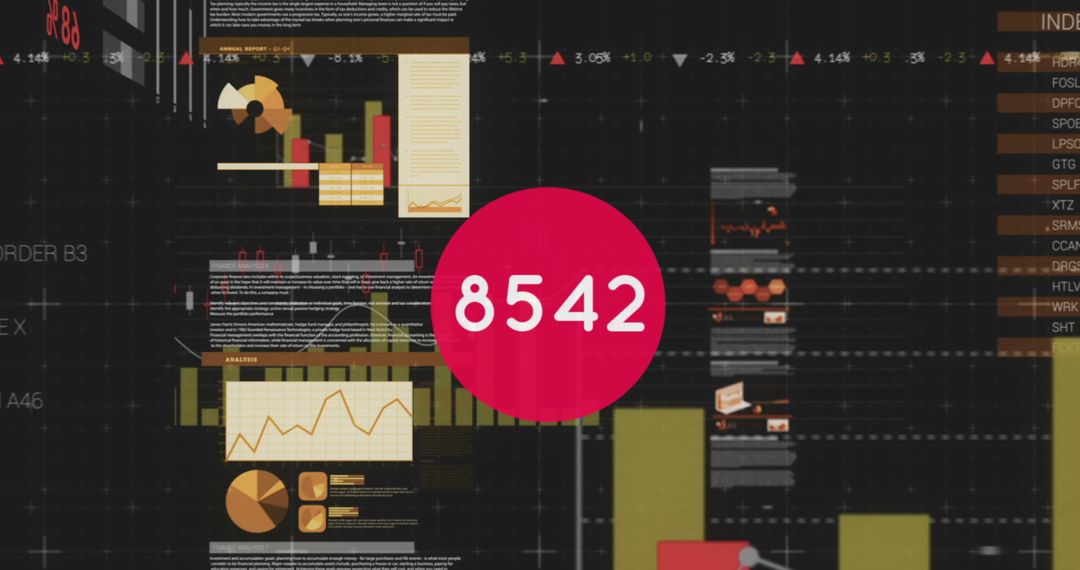
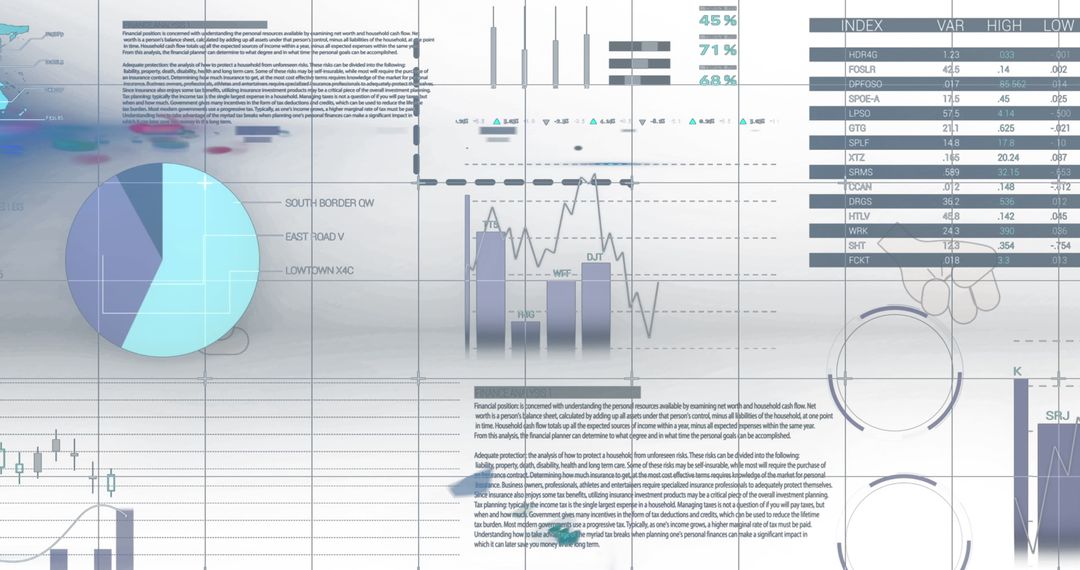
- Digital Financial Data Analysis with Graphs and Charts
Digital Financial Data Analysis with Graphs and Charts Image

This composite shows various sophisticated financial charts and graphs, suitable for illustrating concepts related to stock market trends, financal forecasts, or economic analysis. Ideal for business presentations, financial reports, or technology articles focusing on data visualization in finance.
Powered by 


7
downloads
downloads
Tags:
More
Credit Photo
If you would like to credit the Photo, here are some ways you can do so
Text Link
photo Link
<span class="text-link">
<span>
<a target="_blank" href=https://pikwizard.com/photo/digital-financial-data-analysis-with-graphs-and-charts/753bc75afc448aaef51ad99676053cc5/>PikWizard</a>
</span>
</span>
<span class="image-link">
<span
style="margin: 0 0 20px 0; display: inline-block; vertical-align: middle; width: 100%;"
>
<a
target="_blank"
href="https://pikwizard.com/photo/digital-financial-data-analysis-with-graphs-and-charts/753bc75afc448aaef51ad99676053cc5/"
style="text-decoration: none; font-size: 10px; margin: 0;"
>
<img src="https://pikwizard.com/pw/medium/753bc75afc448aaef51ad99676053cc5.jpg" style="margin: 0; width: 100%;" alt="" />
<p style="font-size: 12px; margin: 0;">PikWizard</p>
</a>
</span>
</span>
Free (free of charge)
Free for personal and commercial use.
Author: Awesome Content
Similar Free Stock Images

Premium


Premium


Premium


Premium


Premium


Premium


Premium


Premium


Premium


Premium


Premium


Premium


Premium


Premium


Premium


Premium


Premium


Premium


Premium


Premium


Premium


Premium


Premium


Premium

