
- Home >
- Stock Photos >
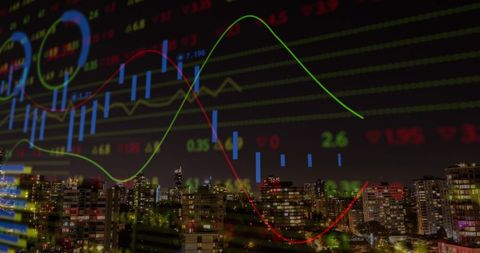
- Digital Financial Data Analysis with Graphs and Code Overlay
Digital Financial Data Analysis with Graphs and Code Overlay Image

This abstract visualization showcases interweaving elements of financial graphs overlaid with programming code, illustrating the complex processes involved in modern financial data analysis. The use of grids and dynamic charts communicates a sense of precision and analytical power, suitable for presentations on financial technologies, fintech solutions, or industry conferences focusing on data analysis tools and techniques.
Powered by 


downloads
Tags:
More
Credit Photo
If you would like to credit the Photo, here are some ways you can do so
Text Link
photo Link
<span class="text-link">
<span>
<a target="_blank" href=https://pikwizard.com/photo/digital-financial-data-analysis-with-graphs-and-code-overlay/e90e799a8c40f2e3445ed82cc2824ed0/>PikWizard</a>
</span>
</span>
<span class="image-link">
<span
style="margin: 0 0 20px 0; display: inline-block; vertical-align: middle; width: 100%;"
>
<a
target="_blank"
href="https://pikwizard.com/photo/digital-financial-data-analysis-with-graphs-and-code-overlay/e90e799a8c40f2e3445ed82cc2824ed0/"
style="text-decoration: none; font-size: 10px; margin: 0;"
>
<img src="https://pikwizard.com/pw/medium/e90e799a8c40f2e3445ed82cc2824ed0.jpg" style="margin: 0; width: 100%;" alt="" />
<p style="font-size: 12px; margin: 0;">PikWizard</p>
</a>
</span>
</span>
Free (free of charge)
Free for personal and commercial use.
Author: Authentic Images
Similar Free Stock Images

Premium


Premium


Premium


Premium


Premium

Premium

Premium


Premium


Premium


Premium


Premium

Premium

Premium


Premium


Premium


Premium

Premium


Premium


Premium


Premium


Premium

Premium


Premium


Premium


Premium

Explore More Free Stock Images