
- Home >
- Stock Photos >
- Digital Financial Data Analysis with Graphs and Tunnel
Digital Financial Data Analysis with Graphs and Tunnel Image
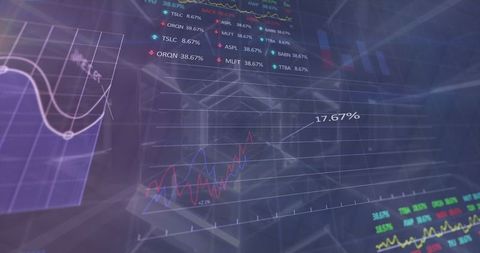
This visualization displays a complex digital interface focusing on financial data analysis. Graphs, stock symbols, and percentage increases contribute to a futuristic theme ideal for showcasing advancements in technology, global business solutions or financial analytics software. Suitable for presentations, articles on finance, technology blogs, or digital marketing content aiming to emphasize innovation in financial resources and stock market monitoring.

downloads
Tags:
More
Credit Photo
If you would like to credit the Photo, here are some ways you can do so
Text Link
photo Link
<span class="text-link">
<span>
<a target="_blank" href=https://pikwizard.com/photo/digital-financial-data-analysis-with-graphs-and-tunnel/b19b976ad0cf9cd192e898db9f2d0f25/>PikWizard</a>
</span>
</span>
<span class="image-link">
<span
style="margin: 0 0 20px 0; display: inline-block; vertical-align: middle; width: 100%;"
>
<a
target="_blank"
href="https://pikwizard.com/photo/digital-financial-data-analysis-with-graphs-and-tunnel/b19b976ad0cf9cd192e898db9f2d0f25/"
style="text-decoration: none; font-size: 10px; margin: 0;"
>
<img src="https://pikwizard.com/pw/medium/b19b976ad0cf9cd192e898db9f2d0f25.jpg" style="margin: 0; width: 100%;" alt="" />
<p style="font-size: 12px; margin: 0;">PikWizard</p>
</a>
</span>
</span>
Free (free of charge)
Free for personal and commercial use.
Author: Creative Art