- Home >
- Stock Photos >
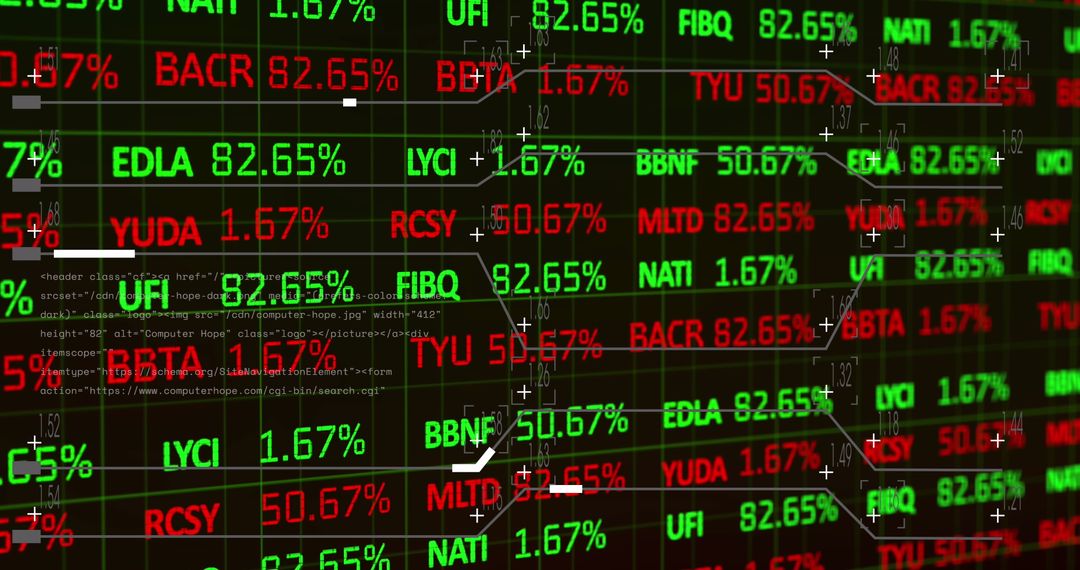
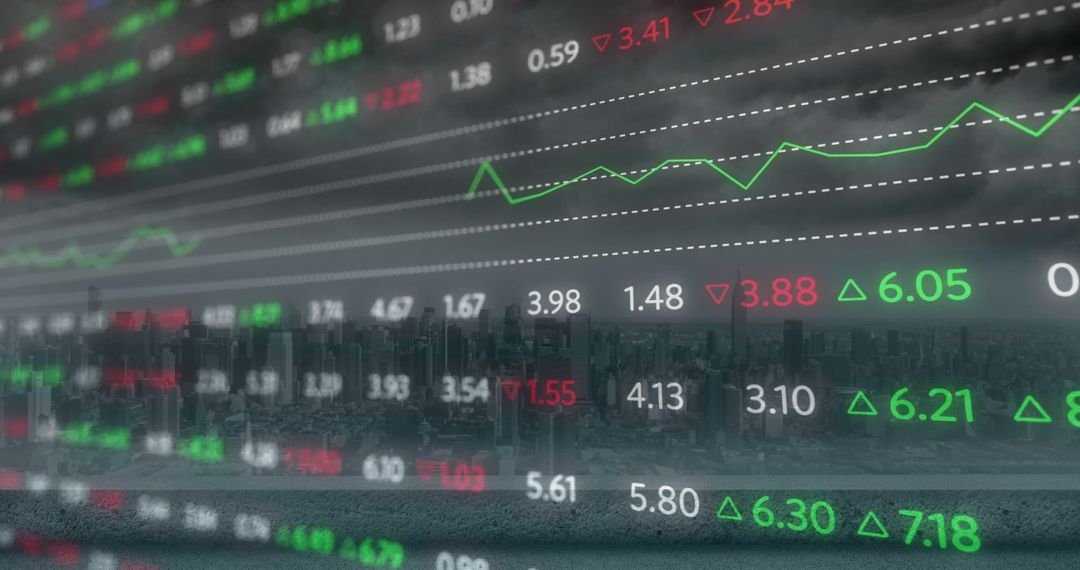
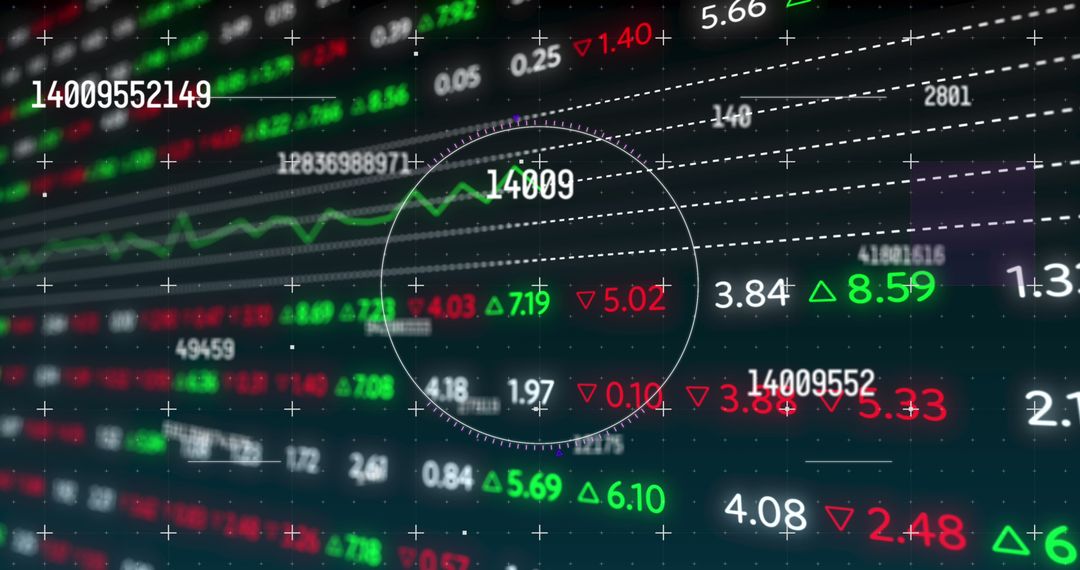
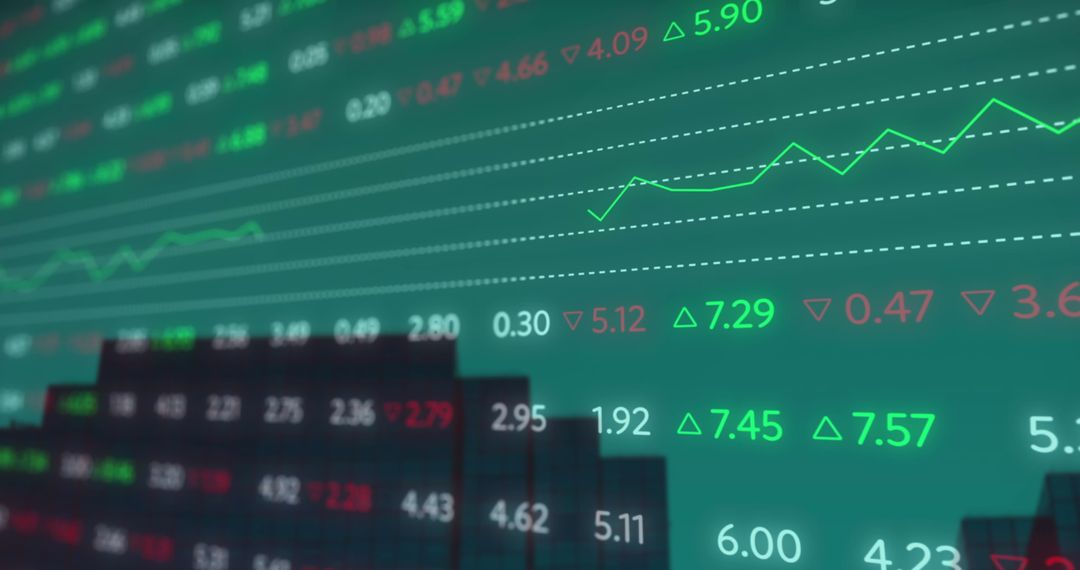
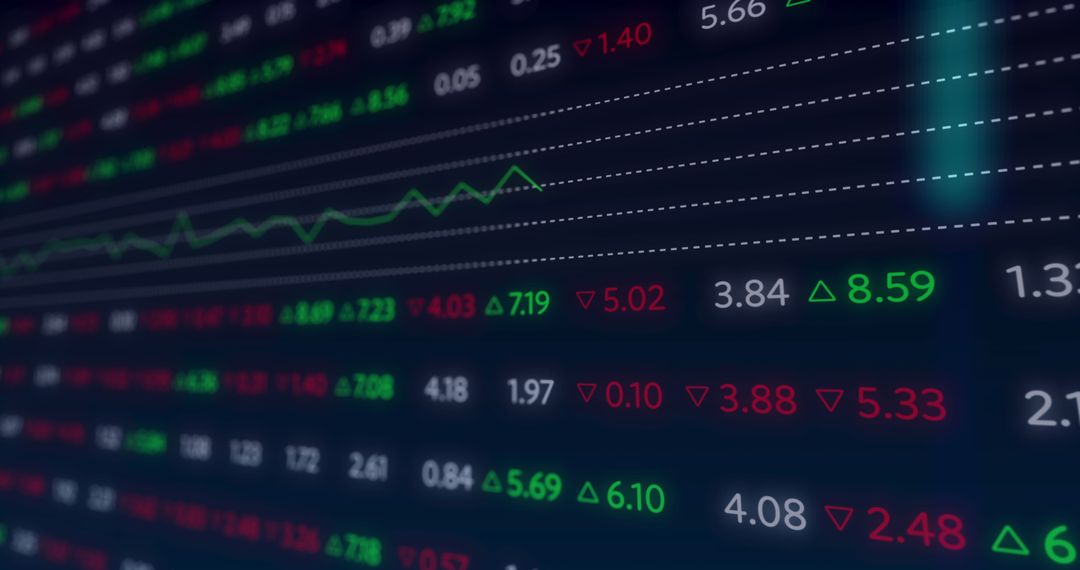
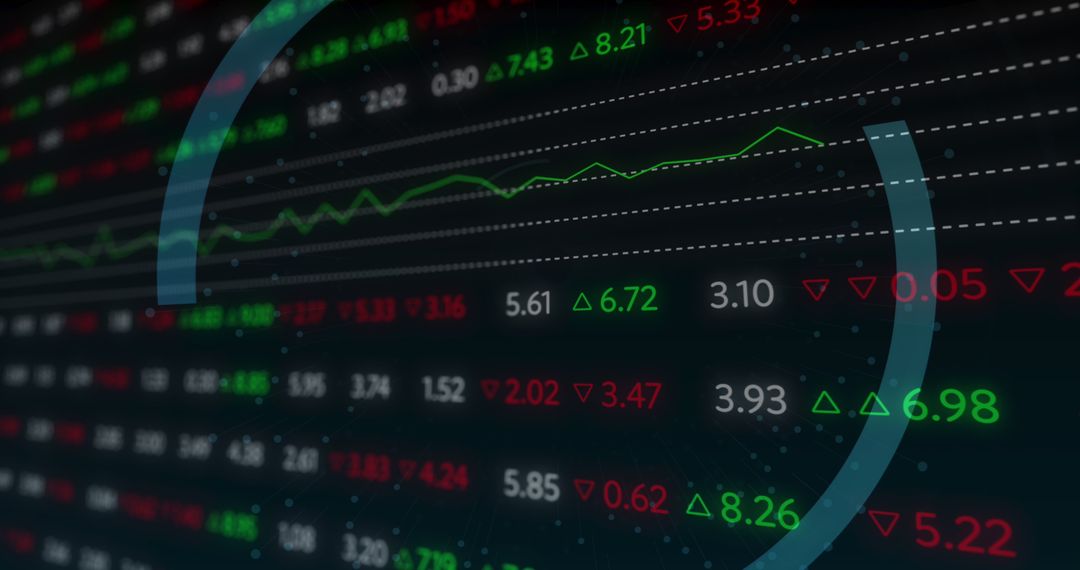
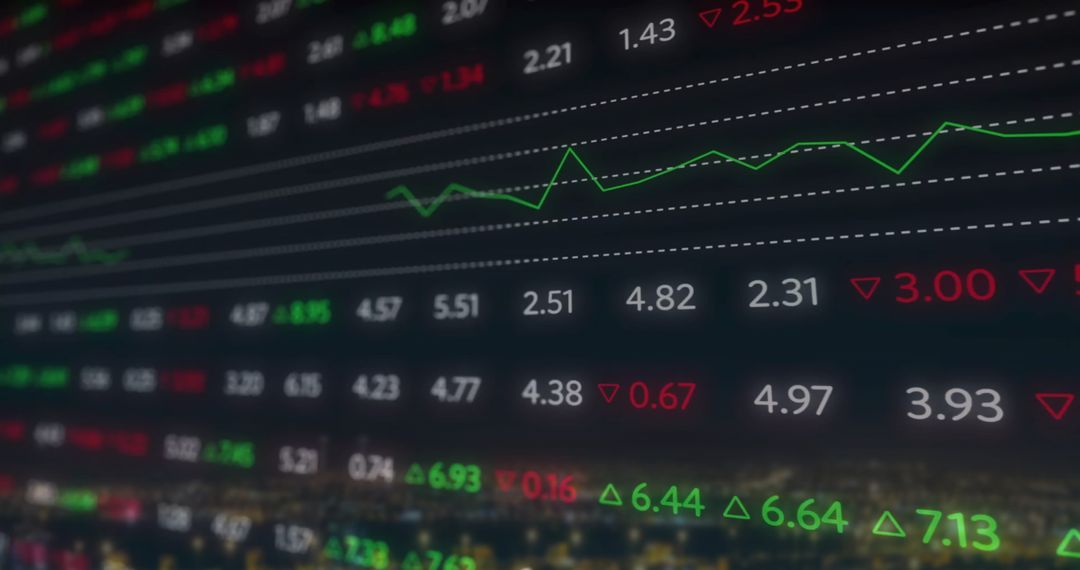
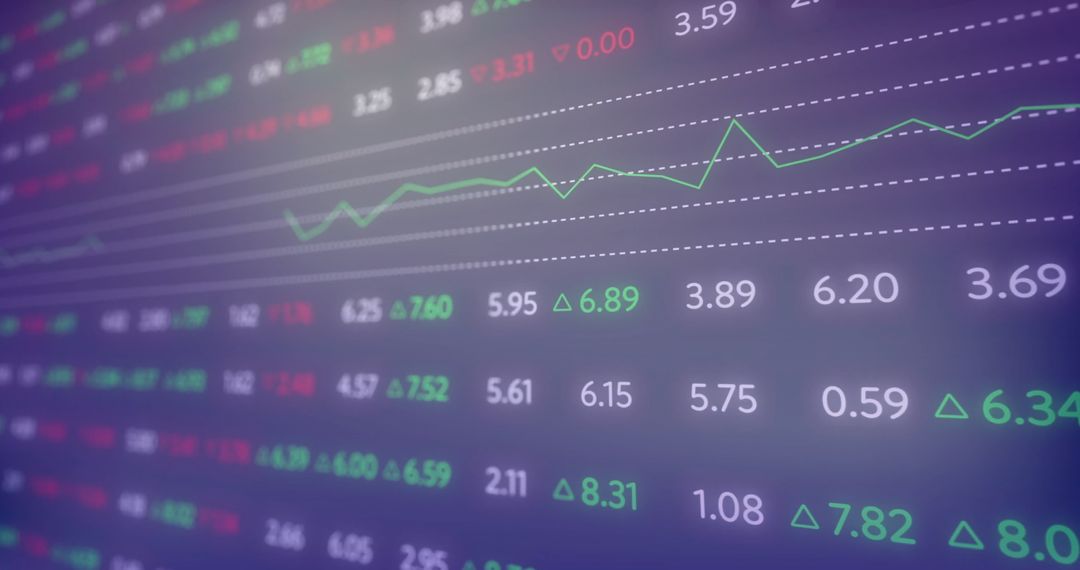
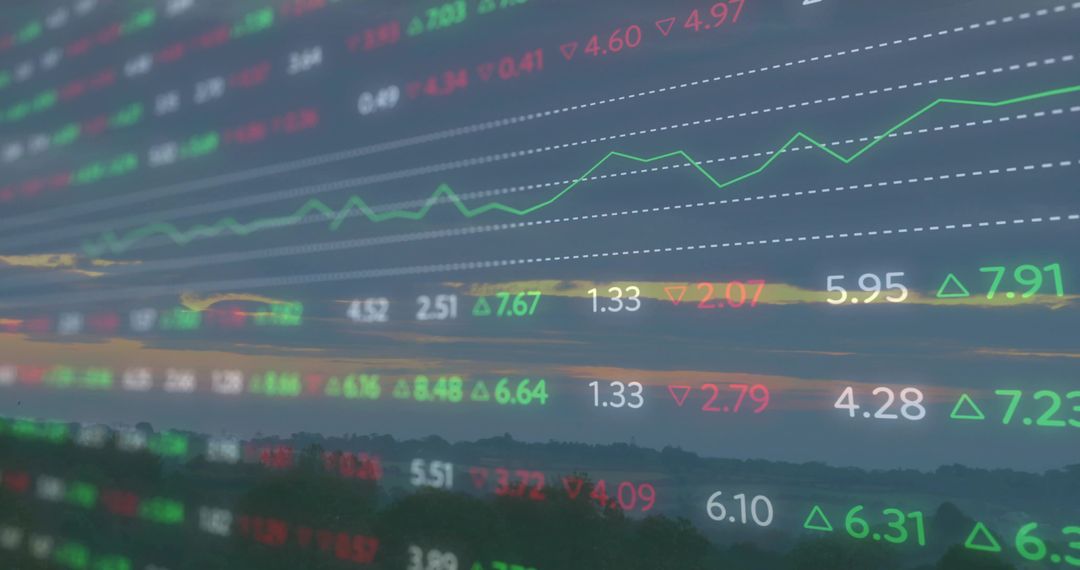
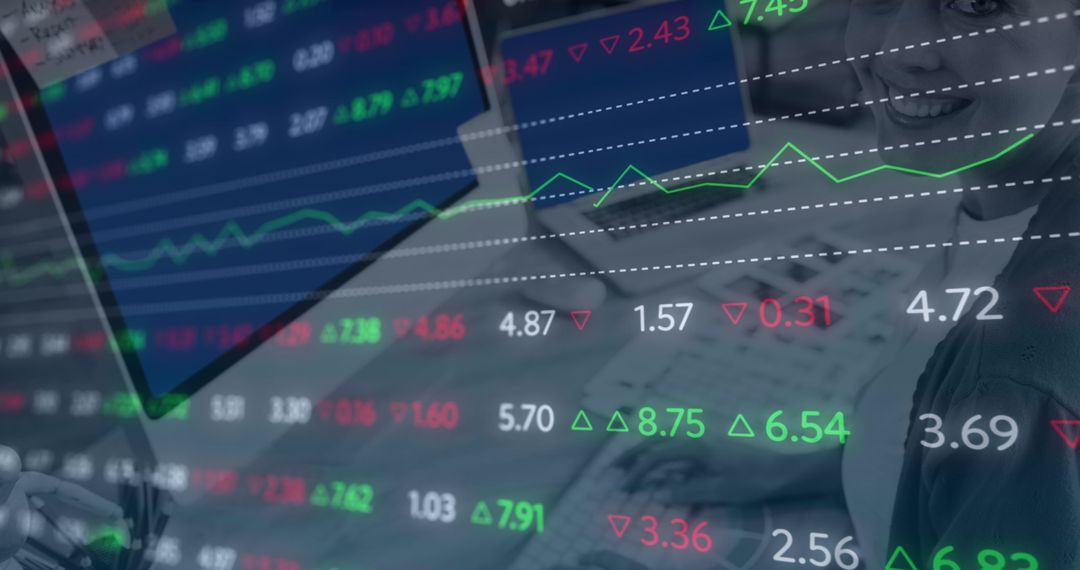
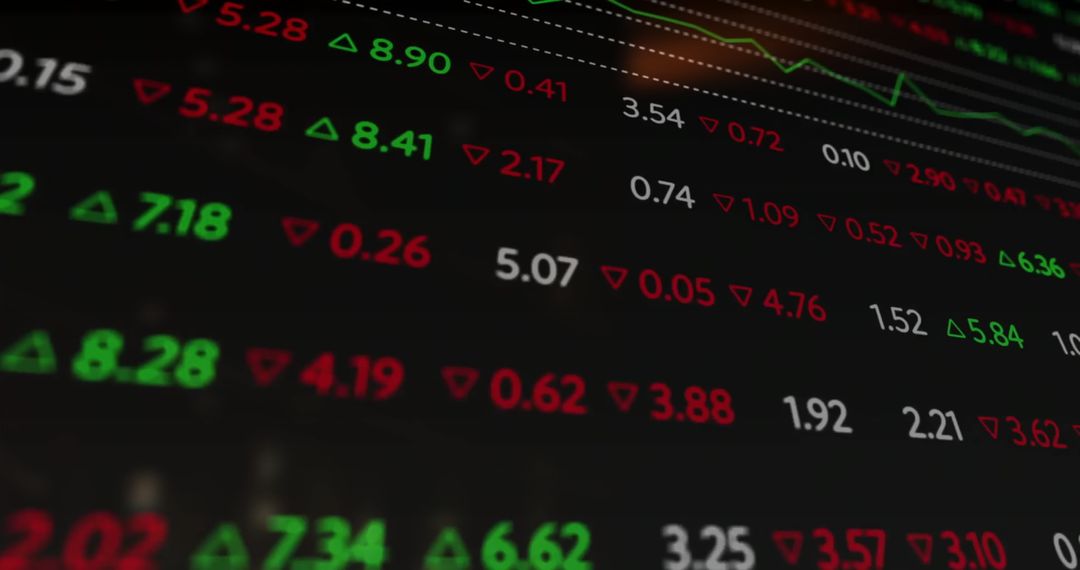
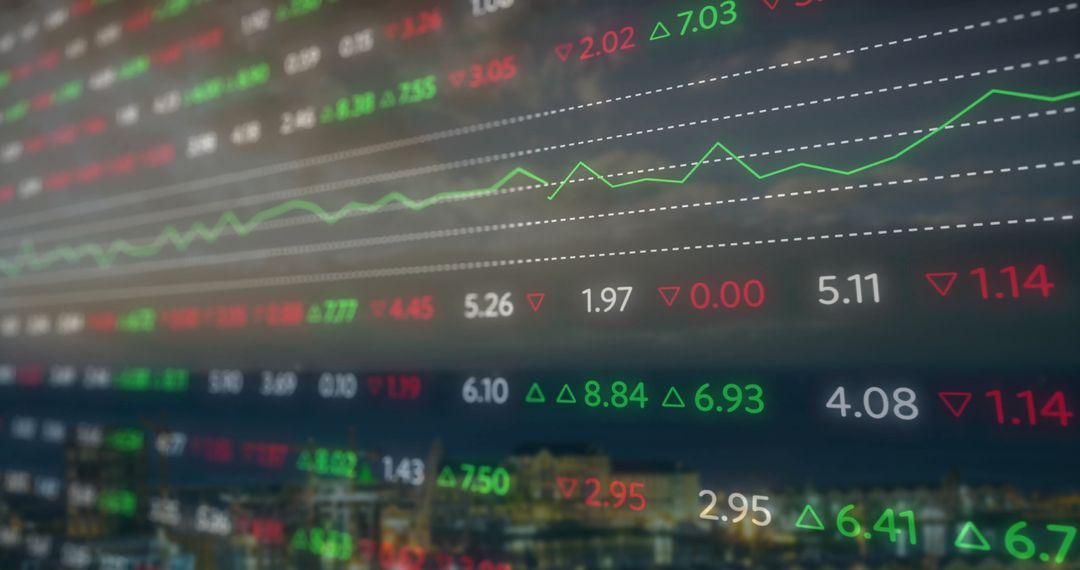
- Digital Financial Data Analysis With Green And Red Charts
Digital Financial Data Analysis With Green And Red Charts Image
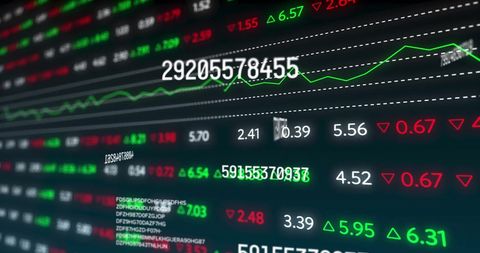
Vibrant display of financial data with highlighted gains and losses presented in red and green. Represents digital finance interface suitable for economic and business themes. Ideal for illustrating financial market activity, global investment strategies, financial software, and data-driven decision-making processes.
Powered by 


2
downloads
downloads
Tags:
More
Credit Photo
If you would like to credit the Photo, here are some ways you can do so
Text Link
photo Link
<span class="text-link">
<span>
<a target="_blank" href=https://pikwizard.com/photo/digital-financial-data-analysis-with-green-and-red-charts/92bef3ca60b557bd200f469684548402/>PikWizard</a>
</span>
</span>
<span class="image-link">
<span
style="margin: 0 0 20px 0; display: inline-block; vertical-align: middle; width: 100%;"
>
<a
target="_blank"
href="https://pikwizard.com/photo/digital-financial-data-analysis-with-green-and-red-charts/92bef3ca60b557bd200f469684548402/"
style="text-decoration: none; font-size: 10px; margin: 0;"
>
<img src="https://pikwizard.com/pw/medium/92bef3ca60b557bd200f469684548402.jpg" style="margin: 0; width: 100%;" alt="" />
<p style="font-size: 12px; margin: 0;">PikWizard</p>
</a>
</span>
</span>
Free (free of charge)
Free for personal and commercial use.
Author: People Creations
Similar Free Stock Images
Premium


Premium


Premium


Premium


Premium


Premium


Premium


Premium


Premium


Premium


Premium


Premium


Premium


Premium


Premium


Premium


Premium

Premium


Premium


Premium

Premium


Premium


Premium


Premium