
- Home >
- Stock Photos >
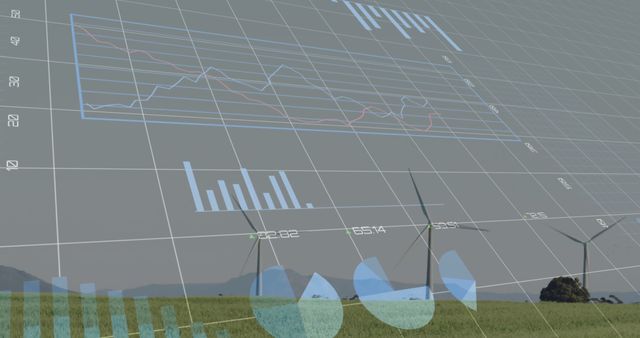
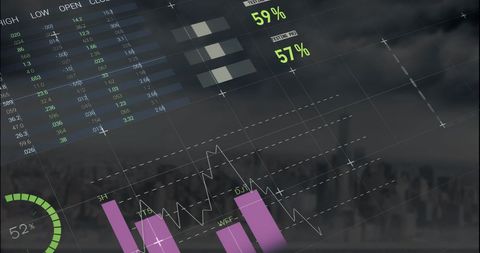
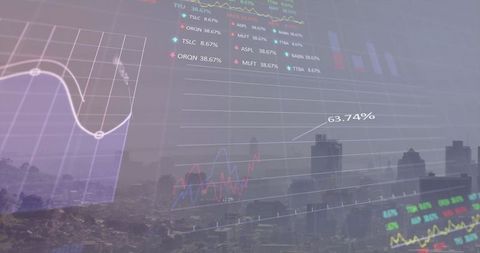
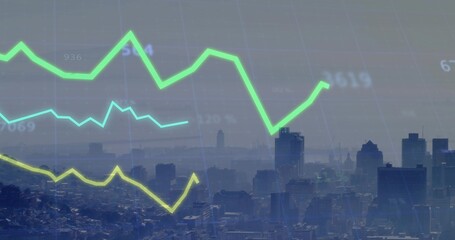
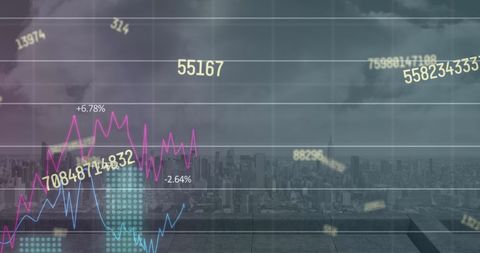
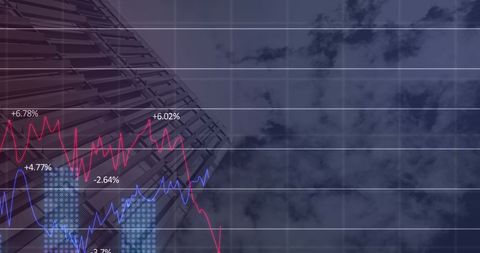
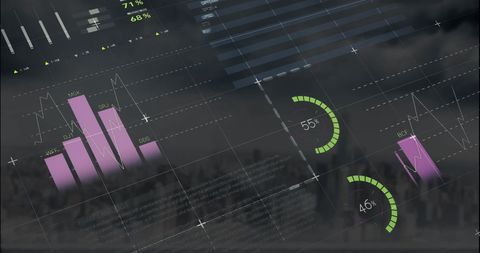
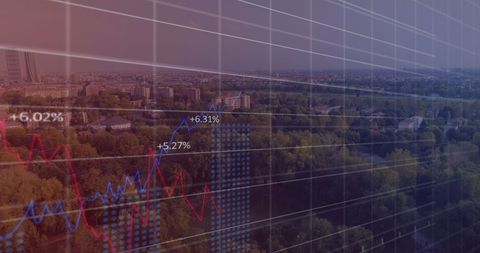
- Digital Financial Data Analytics and Cityscape Technology Integration
Digital Financial Data Analytics and Cityscape Technology Integration Image

Graph overlays depicting data processing are set against a blurred city skyline. Elements represent global business practices and cutting-edge technology interfaces. Ideal for illustrating concepts in finance, investment strategies, market analysis, digital transformation, and urban innovation in presentations, business websites, or financial reports.
Powered by 


downloads
Tags:
More
Credit Photo
If you would like to credit the Photo, here are some ways you can do so
Text Link
photo Link
<span class="text-link">
<span>
<a target="_blank" href=https://pikwizard.com/photo/digital-financial-data-analytics-and-cityscape-technology-integration/4acfeefadbac10c9e7d9b5b51e9b2b73/>PikWizard</a>
</span>
</span>
<span class="image-link">
<span
style="margin: 0 0 20px 0; display: inline-block; vertical-align: middle; width: 100%;"
>
<a
target="_blank"
href="https://pikwizard.com/photo/digital-financial-data-analytics-and-cityscape-technology-integration/4acfeefadbac10c9e7d9b5b51e9b2b73/"
style="text-decoration: none; font-size: 10px; margin: 0;"
>
<img src="https://pikwizard.com/pw/medium/4acfeefadbac10c9e7d9b5b51e9b2b73.jpg" style="margin: 0; width: 100%;" alt="" />
<p style="font-size: 12px; margin: 0;">PikWizard</p>
</a>
</span>
</span>
Free (free of charge)
Free for personal and commercial use.
Author: Awesome Content
Similar Free Stock Images

Premium


Premium


Premium


Premium


Premium


Premium


Premium


Premium


Premium


Premium


Premium


Premium

Premium


Premium

Premium


Premium


Premium


Premium


Premium


Premium

Premium


Premium


Premium


Premium


Premium


Explore More Free Stock Images