- Home >
- Stock Photos >
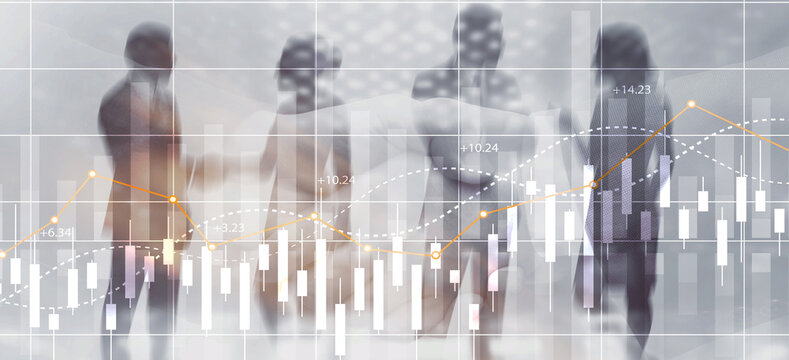
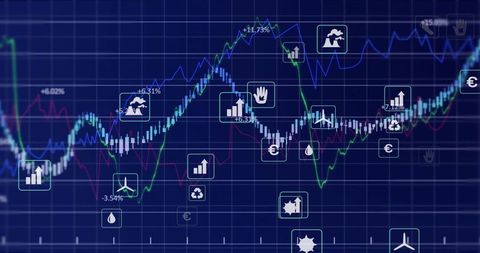
- Digital Financial Data Analytics and Economic Trends
Digital Financial Data Analytics and Economic Trends Image

Abstract representation of financial data processing, showcasing various economic indicators such as inflation, GDP growth, and investment trends. Useful for illustrating topics related to finance, economics, and business analysis in presentations, reports, or educational materials on market trends and economic forecasting.
Powered by 


2
downloads
downloads
Tags:
More
Credit Photo
If you would like to credit the Photo, here are some ways you can do so
Text Link
photo Link
<span class="text-link">
<span>
<a target="_blank" href=https://pikwizard.com/photo/digital-financial-data-analytics-and-economic-trends/beb18f3fd0c317b08752bb49ced37980/>PikWizard</a>
</span>
</span>
<span class="image-link">
<span
style="margin: 0 0 20px 0; display: inline-block; vertical-align: middle; width: 100%;"
>
<a
target="_blank"
href="https://pikwizard.com/photo/digital-financial-data-analytics-and-economic-trends/beb18f3fd0c317b08752bb49ced37980/"
style="text-decoration: none; font-size: 10px; margin: 0;"
>
<img src="https://pikwizard.com/pw/medium/beb18f3fd0c317b08752bb49ced37980.jpg" style="margin: 0; width: 100%;" alt="" />
<p style="font-size: 12px; margin: 0;">PikWizard</p>
</a>
</span>
</span>
Free (free of charge)
Free for personal and commercial use.
Author: Creative Art
Similar Free Stock Images
Loading...

Premium


Premium

Premium


Premium


Premium


Premium


Premium


Premium


Premium
Premium
Premium


Premium

Premium


Premium


Premium

Premium


Premium


Premium


Premium


Premium


Premium


Premium


Premium


Premium


Premium