- Home >
- Stock Photos >
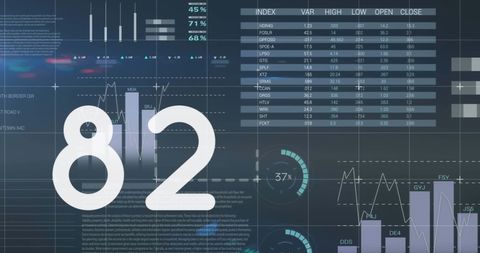
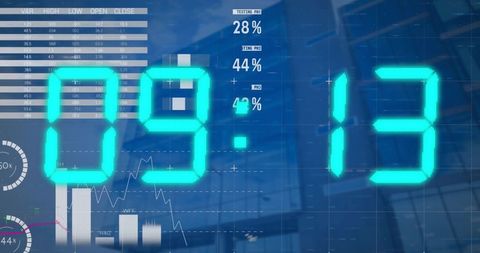
- Digital Financial Data Analytics in Modern Office Background
Digital Financial Data Analytics in Modern Office Background Image

Creative representation of financial data analysis process displayed over a blurred view of a contemporary office environment. The digital interface suggests technology-driven data management, making it suitable for depicting trends in business analytics, finance technologies, and corporate intelligence strategies. This can be used on finance websites, tech blogs, and presentations focused on modern data solutions.

downloads
Tags:
More
Credit Photo
If you would like to credit the Photo, here are some ways you can do so
Text Link
photo Link
<span class="text-link">
<span>
<a target="_blank" href=https://pikwizard.com/photo/digital-financial-data-analytics-in-modern-office-background/ff93aa17f40fd0d43fe01d669668eb82/>PikWizard</a>
</span>
</span>
<span class="image-link">
<span
style="margin: 0 0 20px 0; display: inline-block; vertical-align: middle; width: 100%;"
>
<a
target="_blank"
href="https://pikwizard.com/photo/digital-financial-data-analytics-in-modern-office-background/ff93aa17f40fd0d43fe01d669668eb82/"
style="text-decoration: none; font-size: 10px; margin: 0;"
>
<img src="https://pikwizard.com/pw/medium/ff93aa17f40fd0d43fe01d669668eb82.jpg" style="margin: 0; width: 100%;" alt="" />
<p style="font-size: 12px; margin: 0;">PikWizard</p>
</a>
</span>
</span>
Free (free of charge)
Free for personal and commercial use.
Author: People Creations