1. Home > 
  2. Stock Photos > 
  3. Digital Financial Data Analytics on Black Background

Digital Financial Data Analytics on Black Background Image

Digital Financial Data Analytics on Black Background

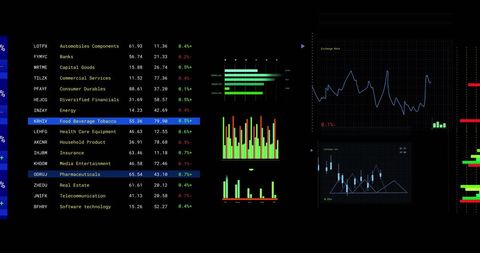
This depiction of digital financial data processing showcases various graphical elements on a black background, including charts and financial statistics. Ideal for illustrating financial technology concepts, business analysis, and global market trends presentations. Perfect for articles about data processing, global finance networks, and digital investment strategies.

Powered by Shutterstock logo - Get 15% off with code: PIKWIZARD15
African Businesswoman Using Analytics Data KPI Dashboard Tech - Powered by Shutterstock - Get 15% off with code: PIKWIZARD15Stockmarket online trading chart candlestick on crypto currency platform. Stock exchange financial market price candles graph data pattern analysis concept. Computer screen closeup background - Powered by Shutterstock - Get 15% off with code: PIKWIZARD15Big data visualization concept. Machine learning algorithms. Analysis of information. Technology data and binary code network conveying connectivity, complexity and data flood of modern digital age. - Powered by Shutterstock - Get 15% off with code: PIKWIZARD15African Businessman Using Analytics Data KPI Dashboard Tech - Powered by Shutterstock - Get 15% off with code: PIKWIZARD15Digital Data Technology. KPI Business Dashboard Technology - Powered by Shutterstock - Get 15% off with code: PIKWIZARD15

Credit Photo

If you would like to credit the Photo, here are some ways you can do so

Free (free of charge)

Free for personal and commercial use.

Author: Awesome Content

Similar Free Stock Images

Loading...
Vibrant Financial Data Lines on Digital Graph Background
Premium
FINANCIAL SERVICE concept with Data analyzing in Forex, Commodities, Equities, Fixed Income and Emerging Markets. the charts and summary info show about "Business statistics and Analytics value".
Global Financial Data Analysis with World Map Visualization
Digital Data Processing with Scope Scanning Interface
Premium
Stock exchange online trading platform chart candlesticks bars, tickers digital data on crypto currency trade financial market platform. Stockmarket graph statistic. Computer screen closeup background
Dynamic Financial Graphs Illustrating Market Trends
Financial Stock Market Data Analysis on Digital Interface
Digital Security in Stock Market Analysis Concept
Analyzing Accelerating Data Trends on Grid with Tech Insights
Futuristic Graph and Data Visualization Interface Design
Premium
Displaying American flag-patterned bar charts in digital space, with wireframe grid and labels. Patriotic, financial, data visualization, abstract, technology, analytics, corporate
Data Security with Tech Bar Graph Overlay
Analyzing Data Trends on Digital Graph Interface
Futuristic Financial Data Visualization on Digital Interface
Digital Financial Data Overlay on Urban Street Scene
Premium
Image of financial data processing over purple shapes on black background. Finances, business, computing and digital interface concept digitally generated image.
Dynamic Stock Market Analysis with Multicolored Statistics
Data Analysis with Advanced Technology Interface Details Profusion
Financial Growth Graph and Data Analytics Representation
Rising Graph Line on Digital Green Grid Background
Premium
Showing shirtless man modeling in studio, displaying line charts with data floating over axes. Financial, analytics, data, visualization, trend, market, performance
Digital Data Flow with Infographics Hologram
Financial Data Analysis on Blue Digital Interface
Dynamic Stock Market Data Analysis With Graphs and Percentages
Dynamic Financial Graphs Overlaying Modern Cityscape
Premium
Showing graphic overlaying world map on screen, with bars, line graph, numeric labels, grid overlay. Data analytics, dashboard, information technology, financial analysis, modern design
Digital Data Waveform on High-Tech Interface
Abstract Financial Data Processing and Analysis Interface
Dynamic Financial Stock Market Analysis Display
Digital Interface Visualizing DNA and Data Patterns
Digital DNA and Brain Data Interface Display in Dark Theme
Dynamic Stock Market Graph with Vibrant Color Lines on Grid
Digital Currency Trading Interface with Data Visualization
Financial Data Visualization with Cityscape Overlay
Dynamic Digital Data Analysis on Elevated Grid
Economic and Political Factors Influence Investment Trends
Financial Data Flow against Urban Skyline Backdrop
Rising Digital Graph and Data Visualizations on Black Background
Premium
Image of graphs, changing numbers, loading circles and bars over black background. Digitally generated, hologram, illustration, report, growth, progress, abstract and business concept.
Premium
Data Analyst Using Data Analytics KPI Dashboard
Digital Data Visualization with Blue Grid and Timeline
Financial Data Line Graph on Digital Display
Digital Financial Data with Graph and Grid Patterns
Premium
Ecommerce Shopping and Market Share Concepts: Putting Trolley on Report Paper in the Office.
Dynamic Data Visualization and Financial Growth Curves
Dynamic Financial Growth Digital Chart Display
Retro Video Display with Digital Interference Effect
Dynamic Business Data and Cityscape Visualization
Abstract Digital Financial Data Chart with Pink Line Oscillations
Financial Data Analysis in Digital Interface with Graphs
Colorful Bar Graph with Data Overlay on Black Background
Dynamic Statistical Data Analysis on Digital Grid Network
Financial Data Processing Visualization with Green Digital Grid
Premium
Image of chemical formula over financial data processing on black background. Global finances, computing and digital interface concept digitally generated image.
Dynamic Financial Data Processing in Green Sphere
NFT Financial Data Visualization with Digital Graph Overlay
Financial Data Analysis with Interactive Graphs
Dynamic Financial Data Overlaid on Grid Background
Premium
Displaying financial chart on screen with blue candlesticks, red or green curves, yellow gridlines. Technology, analytics, data visualization, finance, investment, digital, futuristic
Abstract Digital Data Graph and Diagrams on Gray Background
Fluctuating Stock Market Graph with Dramatic Peaks
Futuristic Digital Representation of DNA Strand
Dynamic Financial Data Graph in Digital Grid Display
Financial Data Streaming with Arrows Over Graphic Indicators
Premium
Stock market online trading chart candlestick on cryptocurrency platform. Computer screen close-up background. Stock exchange financial market price candles graph data pattern analysis concept.
Premium
Data Analyst Using Data Analytics KPI Dashboard
Futuristic Data Visualization on Black Background
Financial Data Charts with World Map on Blue Digital Background
Premium
African Businesswoman Using Analytics Data KPI Dashboard Tech
Dynamic Financial Data Analysis with Virtual Screen
Economic Trends Analysis with Financial Indicators and Graphs
Fluctuating Digital Stock Market Data Chart
Premium
African Businessman Using Analytics Data KPI Dashboard Tech
Digital Data Processing with Graphical Interface
Abstract Digital Interface for Medical Data Processing
Digital Data Network with Dynamic Connections
Financial Data Processing with Digital Patterns for Global Business
Premium
Data Analyst Using Data Analytics KPI Dashboard
Abstract Digital Finance Chart Showing Fluctuating Graph Lines
Analyzing Stock Market Data Trends with Futuristic Visuals
Digital Data Visualization with Trend Lines and Percentage Changes
Financial Data Processing with Rising Graphs
Premium
Red-haired woman wearing black-framed glasses analyzing data on tablet in office, with line graph. Analytic, financial, professional, digital, technology, workplace, modern
Abstract Digital Charts with Social Media Metrics Rising
Data Visualization on Security Shield Interface for Cyber Security
Financial Data Analysis Vibrant Graphs on Blue Background
Dynamic Stock Market Analysis Concept Artwork
Analyzing Financial Data on Digital World Map Background
Cityscape with Digital Stock Market Graphs and Statistics
Fluctuating Financial Graph on Green Grid Background
Futuristic Data Terminal with Code and Digital Interface Overlay
Premium
Image of financial data processing on black background. Global business digital interface technology and networking concept digitally generated image.
Dynamic Graphic of Financial Data Displayed on Graph
Abstract Digital DNA Helix with Geometric Patterns and Nodes
Futuristic Digital Interface with DNA and Brain Diagrams
Digital Stock Market Trends and Financial Growth Analysis
Dynamic Financial Data Visualization over Urban Silhouette
Graphical Analysis on Russian Economy with Financial Metrics
Digital Heart Rate Monitor with Vital Signs Interface
Dynamic Green Stock Chart on Digital Grid Background
Futuristic Digital Interface with Spiraling Coding Patterns
Data Analytics and Financial Growth Indicators
Digital Finance: Modern Stock Market Analysis Display
Financial Data Display in Digital Grid Design
Digital Financial Data Processing Interface on Red Background
Cybersecurity Interface with Digital Shield Icon Displayed
Digital Financial Data Analysis with Graphs and Stock Market Trends
Premium
African Businesswoman Using Analytics Data KPI Dashboard Tech
Digital Financial Data Analysis with Infographics and Charts
Data Analytics Graphs on Digital Interface Background
Financial Data Analysis with Code Interface on Black Background
Premium
FINANCIAL SERVICE concept with Data analyzing in Forex, Commodities, Equities, Fixed Income and Emerging Markets. the charts and summary info show about "Business statistics and Analytics value".
Premium
Businessman hand holding a magnifying glass on black background. Business and financial concept.
Sound Wave Visualization with Programming Code Elements
Rising Financial Data Graph on Digital Grid Background
Holographic Financial Data Visualization with Stock Trends
Data Analysis Graphics on Digital Grid Background
Premium
FINANCIAL SERVICE concept with Data analyzing in Forex, Commodities, Equities, Fixed Income and Emerging Markets. the charts and summary info show about "Business statistics and Analytics value".
Premium
Displaying white-outlined panel showing neon green spikes on grid backdrop, with numeric overlays. Technology, data visualization, analytics, digital interface, financial, neon, futuristic
Digital Data Processing Over Black Background with Green Code
Digital Financial Data Analysis on Grid Framework
Digital Financial Data Visualization on Dark Screen
Dynamic Stock Market Chart with Fluctuating Trends and Data Points
Premium
Crypto stock exchange online trading tickers numbers figures volatility shares price orders digital data on cryptocurrency trade financial market platform board. Computer screen closeup background.
Premium
Image of glowing graphs and processing data over 3d grid on black background. Global communication, business, finance and data interface concept digitally generated image.