
- Home >
- Stock Photos >
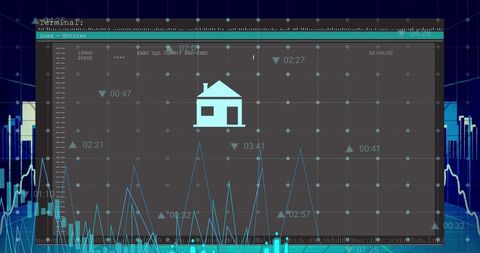
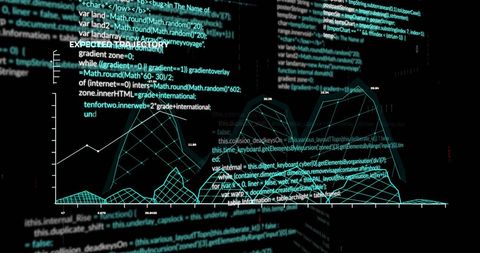
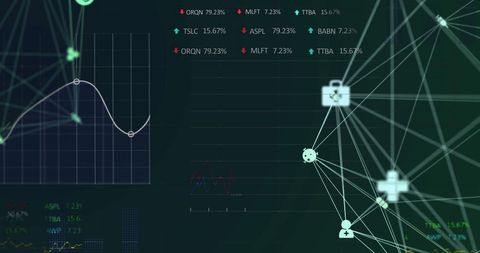
- Digital Financial Data Analytics on Dark Interface
Digital Financial Data Analytics on Dark Interface Image

Displaying complex financial data analysis with graphs and charts set on dark digital interface. Features expected market trends and financial trajectories. Suitable for presentations on financial forecasting, stock market strategies, business analyses, or data science courses.
Powered by 


downloads
Tags:
More
Credit Photo
If you would like to credit the Photo, here are some ways you can do so
Text Link
photo Link
<span class="text-link">
<span>
<a target="_blank" href=https://pikwizard.com/photo/digital-financial-data-analytics-on-dark-interface/476d5bc907398042831f608e72176a04/>PikWizard</a>
</span>
</span>
<span class="image-link">
<span
style="margin: 0 0 20px 0; display: inline-block; vertical-align: middle; width: 100%;"
>
<a
target="_blank"
href="https://pikwizard.com/photo/digital-financial-data-analytics-on-dark-interface/476d5bc907398042831f608e72176a04/"
style="text-decoration: none; font-size: 10px; margin: 0;"
>
<img src="https://pikwizard.com/pw/medium/476d5bc907398042831f608e72176a04.jpg" style="margin: 0; width: 100%;" alt="" />
<p style="font-size: 12px; margin: 0;">PikWizard</p>
</a>
</span>
</span>
Free (free of charge)
Free for personal and commercial use.
Author: Creative Art
Similar Free Stock Images

Premium


Premium

Premium


Premium


Premium


Premium

Premium


Premium

Premium


Premium


Premium


Premium


Premium


Premium


Premium

Premium


Premium


Premium


Premium


Premium


Premium


Premium


Premium

Premium

Premium


Explore More Free Stock Images