
- Home >
- Stock Photos >
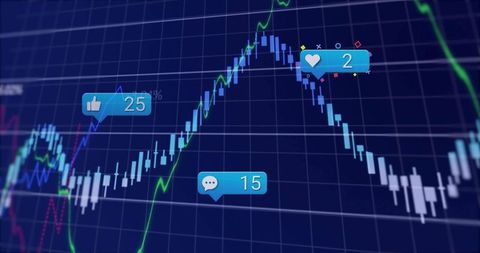
- Digital Financial Data Analytics on Modern Display
Digital Financial Data Analytics on Modern Display Image

Graph depicting financial analytics with rising and falling trends brings attention to global market dynamics. Great for illustrating financial analyses, market forecasts, investment topics, or educational materials related to trading trends and economic progress.
Powered by 


downloads
Tags:
More
Credit Photo
If you would like to credit the Photo, here are some ways you can do so
Text Link
photo Link
<span class="text-link">
<span>
<a target="_blank" href=https://pikwizard.com/photo/digital-financial-data-analytics-on-modern-display/4b00ea784ccb2c6512dec31cc65d7aee/>PikWizard</a>
</span>
</span>
<span class="image-link">
<span
style="margin: 0 0 20px 0; display: inline-block; vertical-align: middle; width: 100%;"
>
<a
target="_blank"
href="https://pikwizard.com/photo/digital-financial-data-analytics-on-modern-display/4b00ea784ccb2c6512dec31cc65d7aee/"
style="text-decoration: none; font-size: 10px; margin: 0;"
>
<img src="https://pikwizard.com/pw/medium/4b00ea784ccb2c6512dec31cc65d7aee.jpg" style="margin: 0; width: 100%;" alt="" />
<p style="font-size: 12px; margin: 0;">PikWizard</p>
</a>
</span>
</span>
Free (free of charge)
Free for personal and commercial use.
Author: Authentic Images
Similar Free Stock Images

Premium


Premium

Premium

Premium


Premium


Premium


Premium


Premium


Premium

Premium

Premium


Premium


Premium


Premium


Premium

Premium


Premium


Premium


Premium


Premium


Premium


Premium


Premium

Premium


Premium
Explore More Free Stock Images