- Home >
- Stock Photos >
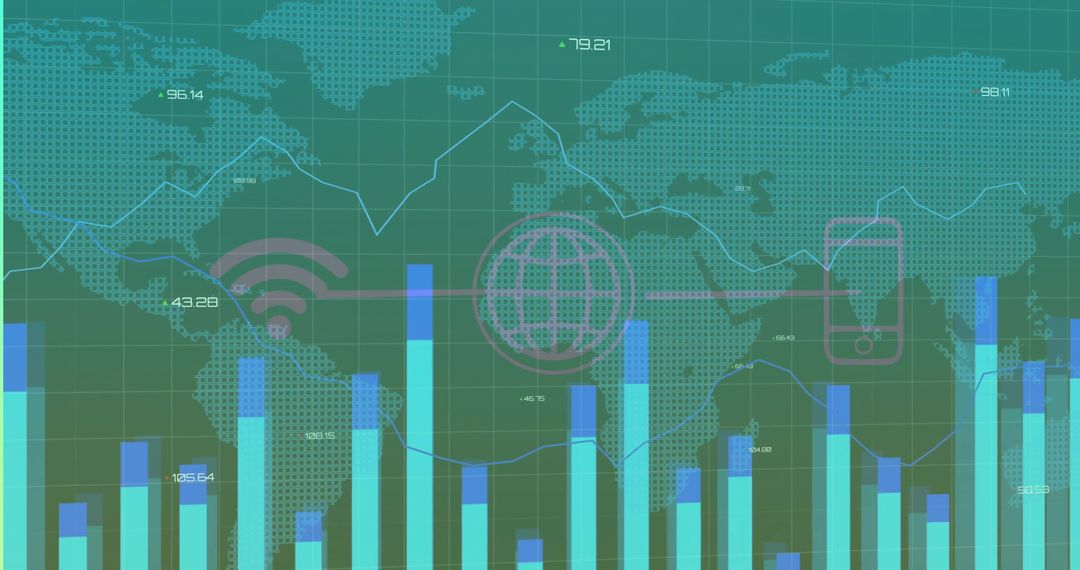
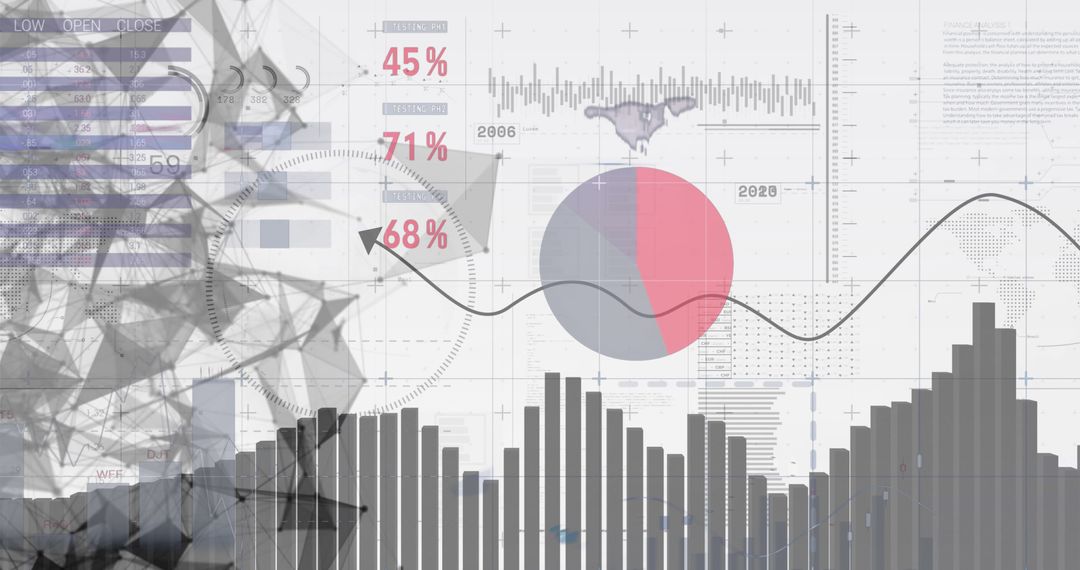
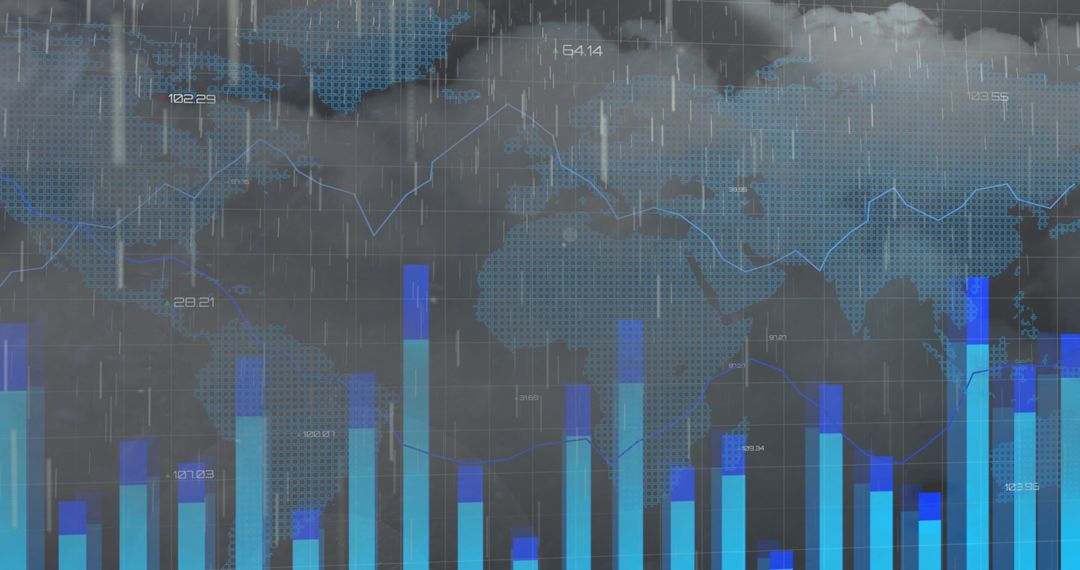
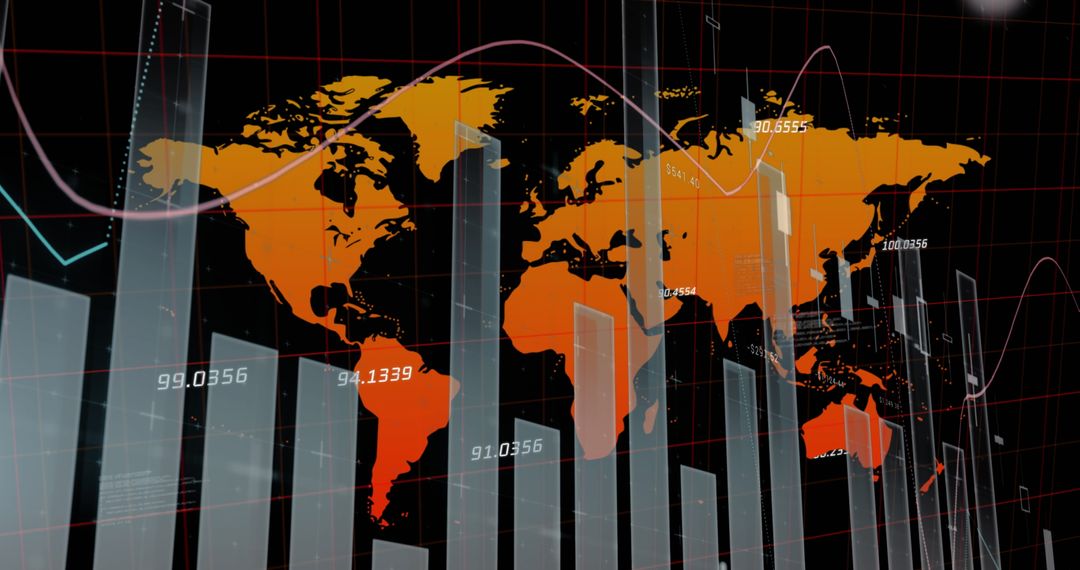
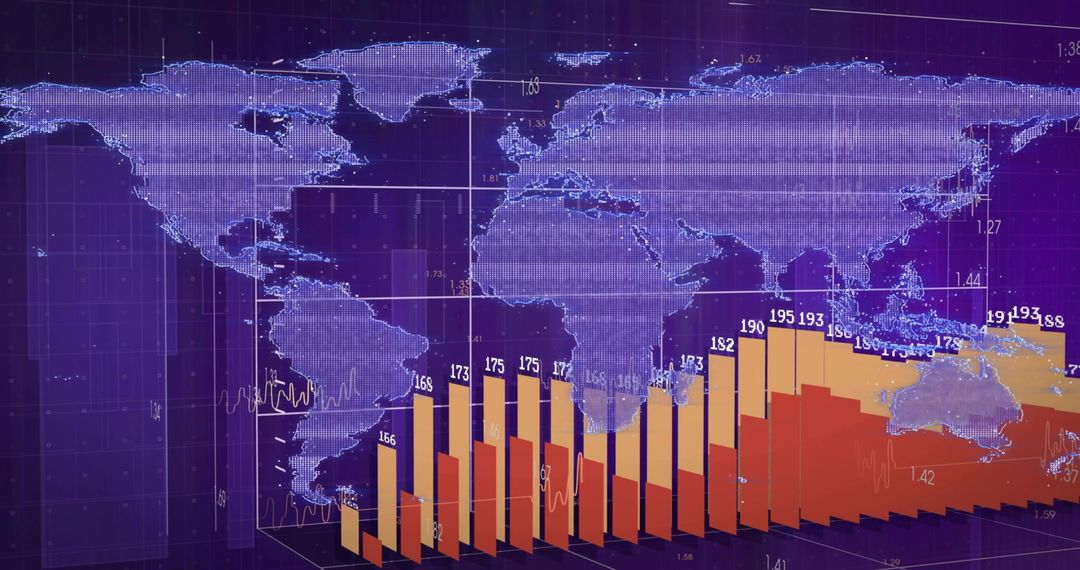
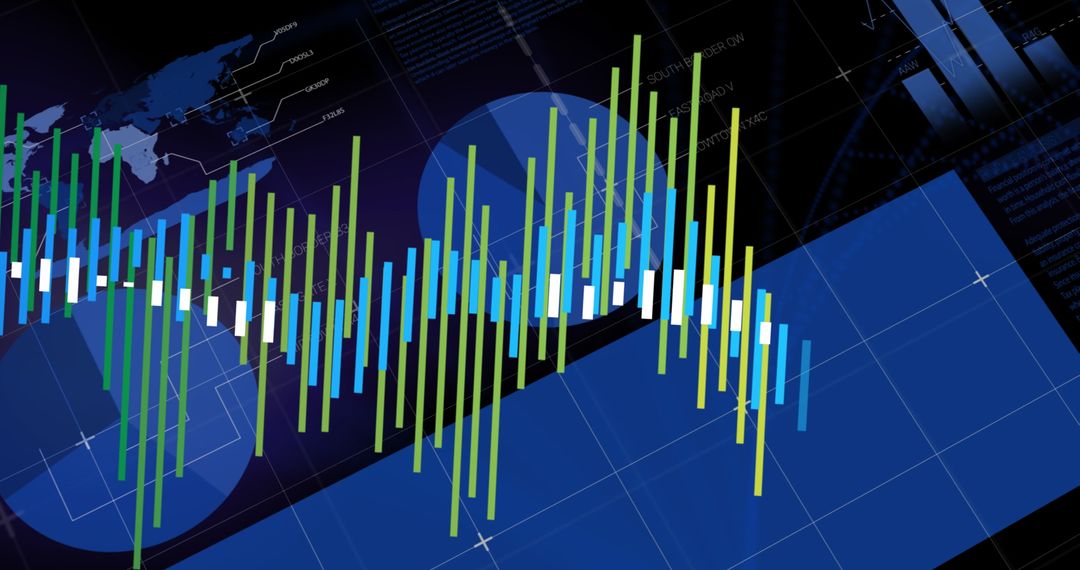
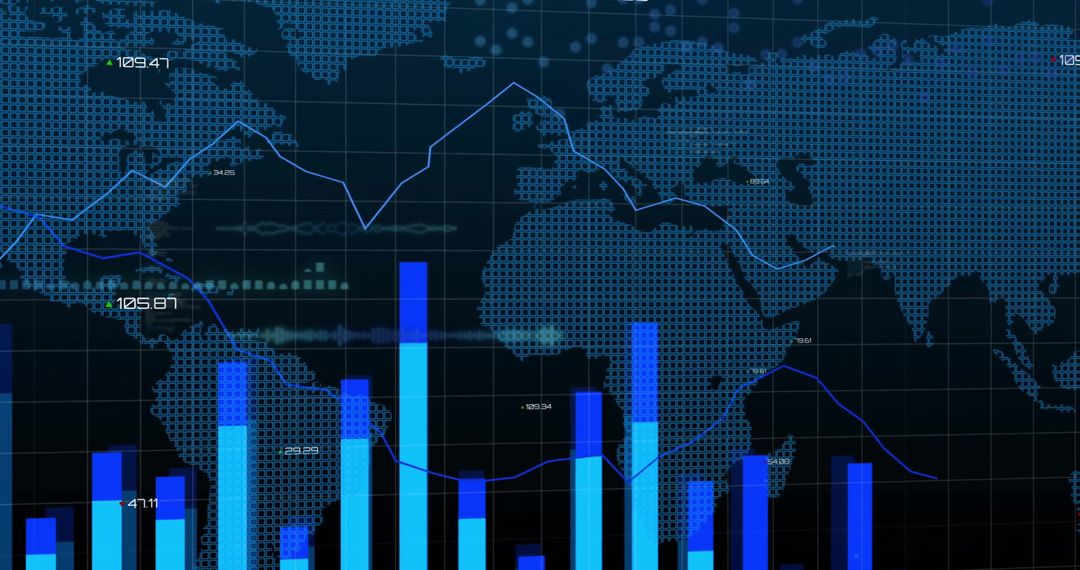
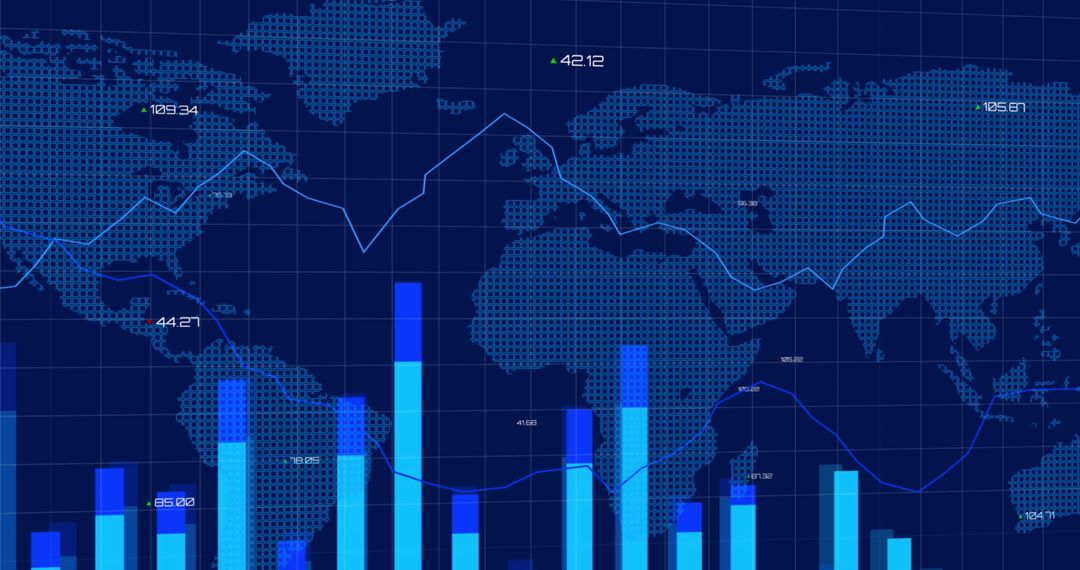
- Digital Financial Data Analytics with Global Charts and Currencies
Digital Financial Data Analytics with Global Charts and Currencies Image

This image depicts digital financial data posing graphs and economic symbols over a dark backdrop of the world map, representing global economic analysis through technology trends. Ideal for illustrating articles and presentations about international finance, market trends, business strategy development, or financial technology advancements. Capture audience attention in contexts involving global economic studies or financial analytics tools deployment.
Powered by  - Get 15% off with code: PIKWIZARD15


4
downloads
downloads
Tags:
More
Credit Photo
If you would like to credit the Photo, here are some ways you can do so
Text Link
photo Link
<span class="text-link">
<span>
<a target="_blank" href=https://pikwizard.com/photo/digital-financial-data-analytics-with-global-charts-and-currencies/cfda4aa6b8277a63b42ac2a8f0b9f247/>PikWizard</a>
</span>
</span>
<span class="image-link">
<span
style="margin: 0 0 20px 0; display: inline-block; vertical-align: middle; width: 100%;"
>
<a
target="_blank"
href="https://pikwizard.com/photo/digital-financial-data-analytics-with-global-charts-and-currencies/cfda4aa6b8277a63b42ac2a8f0b9f247/"
style="text-decoration: none; font-size: 10px; margin: 0;"
>
<img src="https://pikwizard.com/pw/medium/cfda4aa6b8277a63b42ac2a8f0b9f247.jpg" style="margin: 0; width: 100%;" alt="" />
<p style="font-size: 12px; margin: 0;">PikWizard</p>
</a>
</span>
</span>
Free (free of charge)
Free for personal and commercial use.
Author: People Creations
Similar Free Stock Images
Premium


Premium


Premium


Premium


Premium


Premium

Premium


Premium


Premium


Premium


Premium


Premium


Premium


Premium


Premium

Premium


Premium


Premium


Premium


Premium


Premium


Premium


Premium


Premium