1. Home > 
  2. Stock Photos > 
  3. Digital Financial Data Analytics with Global Networking

Digital Financial Data Analytics with Global Networking Image

Digital Financial Data Analytics with Global Networking

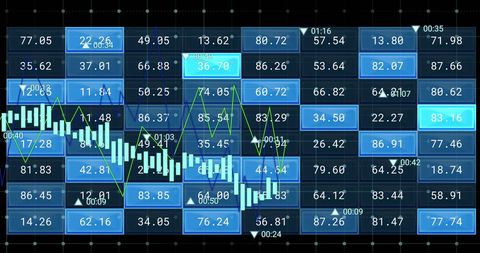
Abstract representation of financial data analytics showing numbers on digital screens. Ideal for illustrating global business strategies, financial market analysis, and technological advances in data processing. Use in contexts that highlight the interplay of technology and finance, such as investment strategy presentations and financial services marketing.

Powered by Adobe logo
Hand presents an illuminated digital progress gauge, embodying data analytics, performance optimization, and innovative technology solutions for business - Powered by AdobeBusiness professional presenting a glowing clock surrounded by dollar signs - Powered by AdobeModern skyscraper with futuristic data visualization overlay representing corporate growth, financial analytics, and global business network technology. - Powered by AdobeBusiness partners shaking hands with global network and financial growth overlay - Powered by AdobeModern tablet displaying glowing global network and financial data charts - Powered by Adobe

Credit Photo

If you would like to credit the Photo, here are some ways you can do so

Free (free of charge)

Free for personal and commercial use.

Author: People Creations

Similar Free Stock Images

Digital Financial Data Analysis with Infographics and Charts
Premium
Business growth and data analysis concept with hand touching digital bar chart on blurred city night background
Digital Cityscape with Financial Data Overlay
Premium
Business people analyzing financial data on futuristic holographic display in modern office meeting
Premium
Business professionals analyzing global economic growth through digital financial data technology, blockchain, and secure network systems
Global Financial Data Analysis with World Map Visualization
Digital Analysis of Financial Data with Dynamic Graphs
Dynamic Stock Market Trends with Graphs on Digital Display
Displaying multi-series bar chart with smooth trend lines and metric callouts on dark navy backgroun
Data Processing Overlaid on Graphs and Code in Digital Interface
Jagged Line Chart Showing Social Engagement Notifications on Dark Blue Grid with Metric
Abstract Graphic Business Data Visualization
Premium
Rotating glass globe on digital surface showcasing global market data and financial trends
Dynamic Financial Data Graphs Networking in Global Business
Innovative Digital Finance Data Display on Dark Interface
Financial Data Analysis with Interactive Graphs
Digital Financial Data and Dynamic Stock Market Graphs
Premium
Digital world map with dynamic financial data and global analytics visualization
Digital Stock Market Data and Trends Visualization
Premium
Hand touching futuristic glowing "2028" with icons of DeFi, crypto, AI, and digital wallets
Digital Financial Chart Showing Growth and Dynamic Indicators
Financial Stock Market Data Analysis on Digital Interface
Dynamic Data Visualization with Financial Charts and 3D Elements
Financial Data Visualization with Futuristic Interface
Premium
Businessman uses tablet, holographic global network with digital icons
Dynamic Financial Graphs Over Cityscape Background
Futuristic Financial Data Analysis with Graphs and Charts
Digital Financial Data Analysis with Graphs and Stock Market Trends
Digital Financial Data Analysis on Dark Background
Premium
Futuristic glowing blue and purple stock market trading graph with map overlay finance
Digital Icons with Financial Data Overlay on Blue Background
Dynamic Financial Growth Digital Chart Display
Futuristic Financial Data Visualization and Digital Interface
Dynamic Financial Data Analysis with Growth Indicators
Global Financial Data Visualization and Analysis
Dynamic Digital Stock Market Ticker with Growing Graph Trends
Abstract Digital Financial Data Chart with Pink Line Oscillations
Premium
Business consultant focusing on global expansion strategy and planning resource allocation for organization, using digital tools to forecast insights and achieve corporate growth.
Premium
This image illustrates a digital financial growth chart over a keyboard, symbolizing business trends, market analysis, and technological advancements in the finance sector. Copula
Premium
Global network connection, digital earth, data visualization, financial market.
Premium
Abstract digital network globe connected to interactive data analytics dashboards, illustrating global technology, security, and data insights
Digital Financial Data Analytics on Modern Display
Stock Market Graph with Social Media Notifications Overlay
Digital Data Visualization with Blue Grid and Timeline
Premium
Upward arrow graph with global digital map background symbolizing financial growth, business technology, and global market data trends. 3D Rendering
Premium
Stylized dotted world map overlaid with stock market data, charts, and gridlines
Stock Market Analysis with Graphs and Trading Data
Digital Financial Graph with Rising Line Trend on Dark Background
Dynamic Financial Data Analysis in Digital Interface
Premium
Businessman interacting with holographic financial data on a tablet
Global Financial Data and Stock Market Trends on World Map
Global Financial Data Processing with Digital Interface Elements
Digital Financial Data Analysis on Abstract Blue Background
Digital Financial Data Visualization with Urban Cityscape
Premium
Fintech 3d data visualization of a glowing world map highlighting global financial connections in green on a dark grid background
Dynamic Global Financial Data with Multicolored Graph Lines
Financial Growth Graph and Data Analytics Representation
Dynamic Financial Data with Fluctuating Graph Lines
Financial Data Streaming with Arrows Over Graphic Indicators
Premium
Human hand holding a glowing abstract digital globe with financial data visualization and connectivity
Dynamic Digital Stock Market Chart with Growing Financial Trends
Dynamic Stock Market Data Analysis With Graphs and Percentages
Graph Showing Stock Market Activity and Financial Data Analysis
Abstract Financial Data Analysis and Stock Market Trends
Premium
Modern Digital Business Growth Concept Illustration with Upward Arrow and Bar Chart
Digital Stock Market Trends and Financial Growth Analysis
Dynamic Data Analytics Interface Showing Statistical Trends
Innovative Data Analysis over DNA Strand
Dynamic Financial Data Analysis with Virtual Screen
Financial Data Analysis on Blue Digital Interface
Dynamic Stock Market Trends and Financial Data Graph
Digital Finance Data with Icon Overlay on Blue Background
Financial Graphs and Digital Data on Dark Background
Digital Graphs Representing Data and Analytics on Black Background
Digital Financial Data with Trending Arrows
Dynamic Financial Data Analytics Display with Graphs
Digital Financial Data and Global Business Analytics
Digital Icons on Data Grid Network Depicting Business Concepts
Premium
A glowing globe anchors financial data screens, visualizing global markets in a futuristic command hub.
Dynamic Financial Data Graphed Over Digital Grid
Dynamic Financial Graphs Illustrating Market Trends
Financial Data Visualization with Line and Bar Graphs
Digital Chart Display Financial Data Analysis Background Effects
Premium
Time is money a businessman presenting a clock made of dollar signs
Holographic Financial Data Visualization with Stock Trends
Financial Data Charts with Network Connections Digital Interface
Financial Data Analysis in Digital Interface with Graphs
Binary Code Flowchart Background with Digital Animation
Premium
Global digital economy and stock market concept,3D hologram of Earth with bar graphs and trend lines in futuristic boardroom,depicting global financial analytics
Graph and Chart Display on White Grid Background
Stock Market Analysis and Data Processing Graphic
Digital Stock Market Chart and Networking Interface
Analyzing Financial Graphs with Real-Time Data Trends
Premium
Businessman in suit back view analyzing futuristic glowing data screens displaying global maps and charts
Eco-Friendly Icons Overlaid on Rising Stock Market Graph
Digital Financial Data Processing and Analysis Graphics
Dynamic Graphic of Financial Data Displayed on Graph
Digital Financial Graphs and Data Analysis Visualization
Dynamic Digital Data Processing and Analysis Graphs
Dynamic Stock Market Analysis Concept Artwork
Dynamic Statistical Data Analysis on Digital Grid Network
Economic Trends Analysis with Financial Indicators and Graphs
Financial Chart with Dynamic Data on Black Grid
Digital Stock Market Analysis with Graphs and Charts
Digital Projection of Financial Data with Bar Graphs
Premium
Global finance monitoring in high-tech portal
Digital Data Processing with Technology Interface on Blue Background
High-Tech Financial Data Analysis Display with Graphs
Rising Graphs and Interactive Financial Data Analytics Background
Analyzing Financial Data on Digital World Map Background
Data Analytics with Dynamic Global Market Trends on Screen
Dynamic Financial Data Against Urban Skyline
Abstract Financial Data Visualization with Graphs
Abstract Digital Stock Market Analysis with Graphs
Financial Data Analysis with Graphs and Charts on Dark Background
Abstract Data Visualization Digital Chart Background
Premium
Dynamic digital network visualization showcasing data flow between interconnected nodes and currency symbols, representing secure financial transactions and global connectivity.
Futuristic Keyboard Analytics Display with Digital Graphs and Numbers
Digital Financial Data Processing Interface on Red Background
Financial Data Analysis Over Vibrant Cityscape Background
Data Security with Tech Bar Graph Overlay
Premium
Digital cloud computing technology with financial and business icons in a futuristic interface
Dynamic Financial Graph on Digital Background
Dynamic Data Visualization Depicting Financial Growth Trends
Digital Interface with Data Analysis Graphics on Blue Background
Explore More Free Stock Images