- Home >
- Stock Photos >
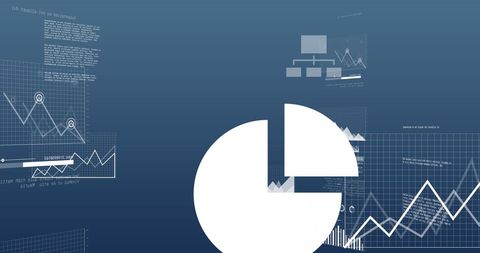
- Digital Financial Data Analytics with Graphs and Charts
Digital Financial Data Analytics with Graphs and Charts Image

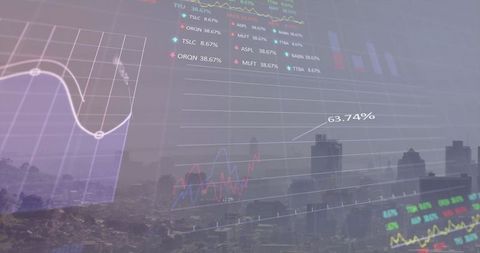
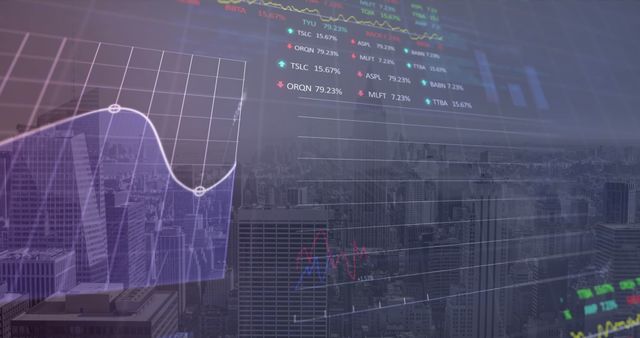
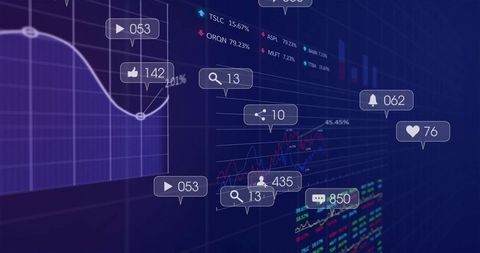
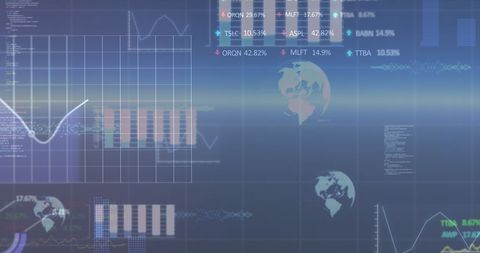
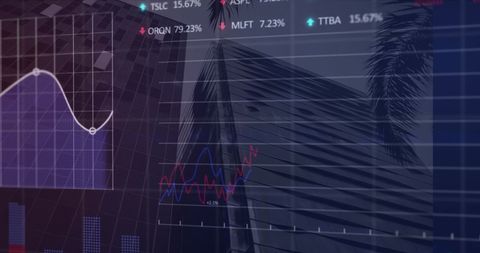
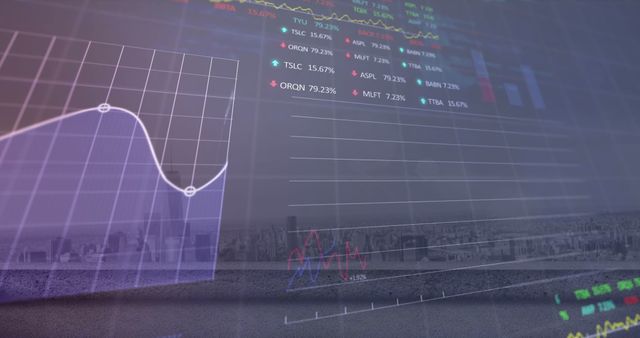
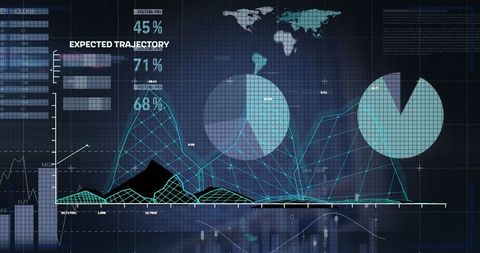
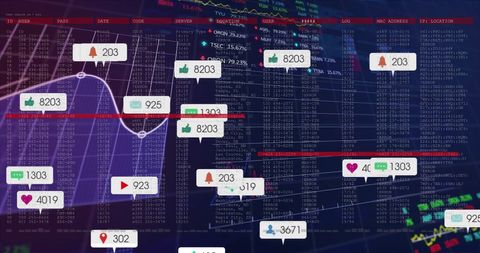
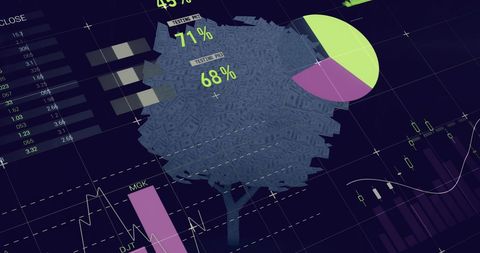
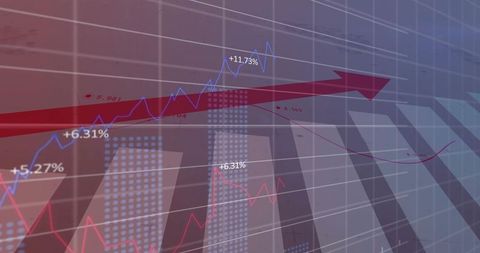
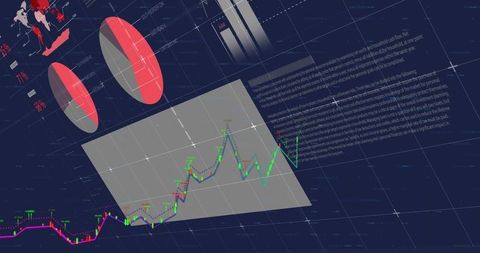
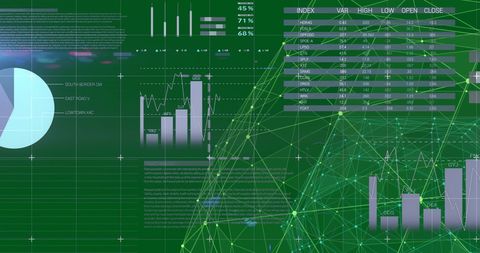
Visual showing complex financial data analysis, including dynamic graphs and charts, suggesting global business finance trends and economic prediction. Useful for illustrating economic data discussions, stock market analysis, investments education materials, and financial strategy presentations.

downloads
Tags:
More
Credit Photo
If you would like to credit the Photo, here are some ways you can do so
Text Link
photo Link
<span class="text-link">
<span>
<a target="_blank" href=https://pikwizard.com/photo/digital-financial-data-analytics-with-graphs-and-charts/ec55fadc4cc96714f971f99eaf97bbf6/>PikWizard</a>
</span>
</span>
<span class="image-link">
<span
style="margin: 0 0 20px 0; display: inline-block; vertical-align: middle; width: 100%;"
>
<a
target="_blank"
href="https://pikwizard.com/photo/digital-financial-data-analytics-with-graphs-and-charts/ec55fadc4cc96714f971f99eaf97bbf6/"
style="text-decoration: none; font-size: 10px; margin: 0;"
>
<img src="https://pikwizard.com/pw/medium/ec55fadc4cc96714f971f99eaf97bbf6.jpg" style="margin: 0; width: 100%;" alt="" />
<p style="font-size: 12px; margin: 0;">PikWizard</p>
</a>
</span>
</span>
Free (free of charge)
Free for personal and commercial use.
Author: Creative Art