- Home >
- Stock Photos >
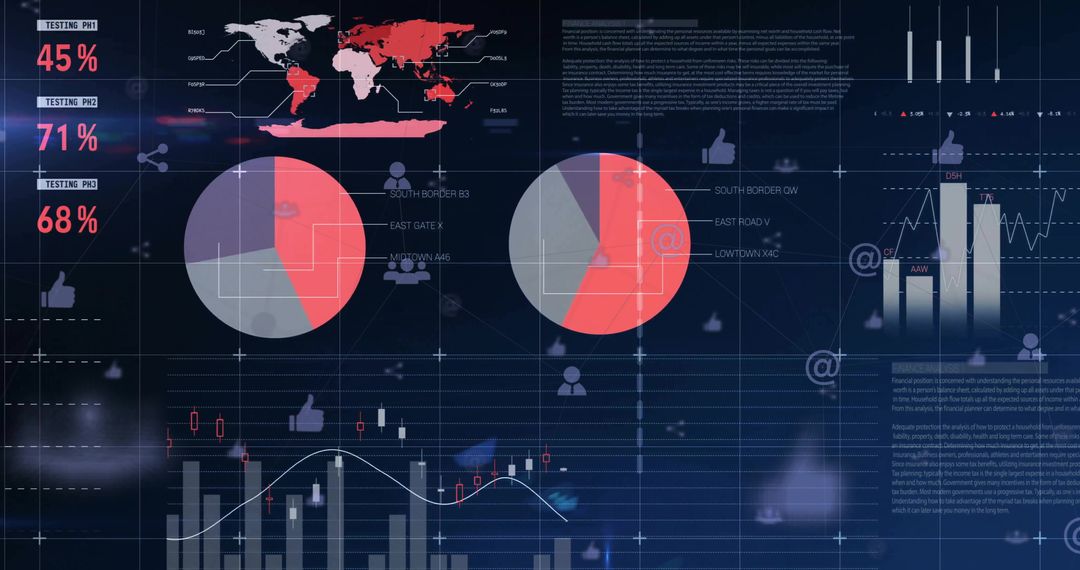
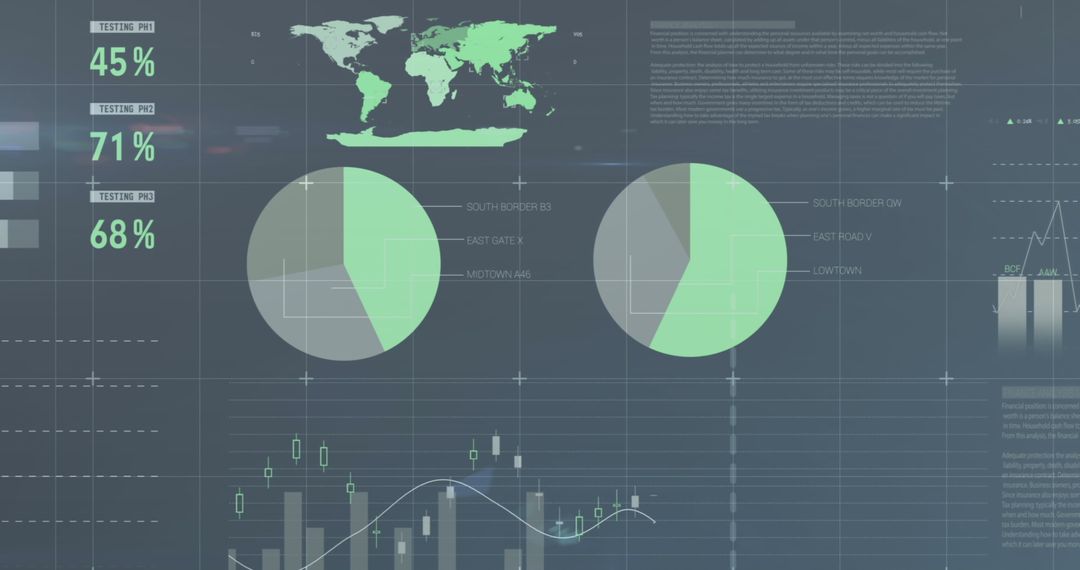
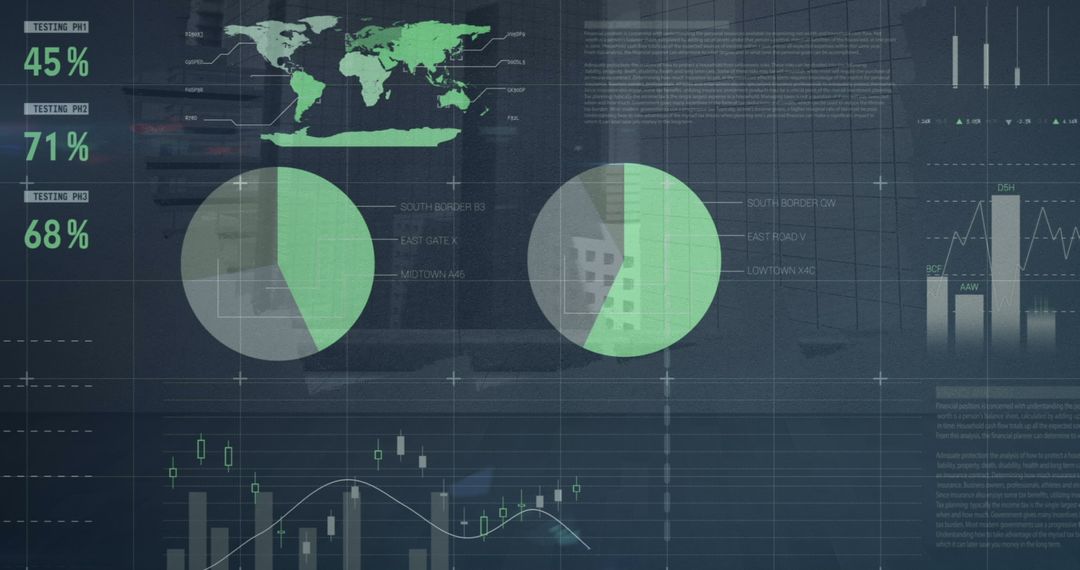
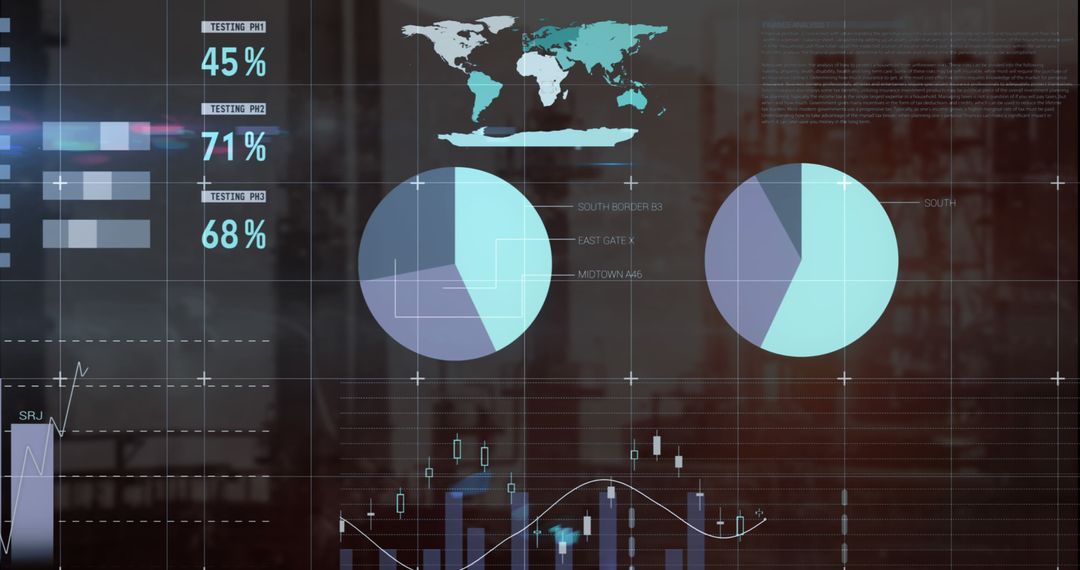
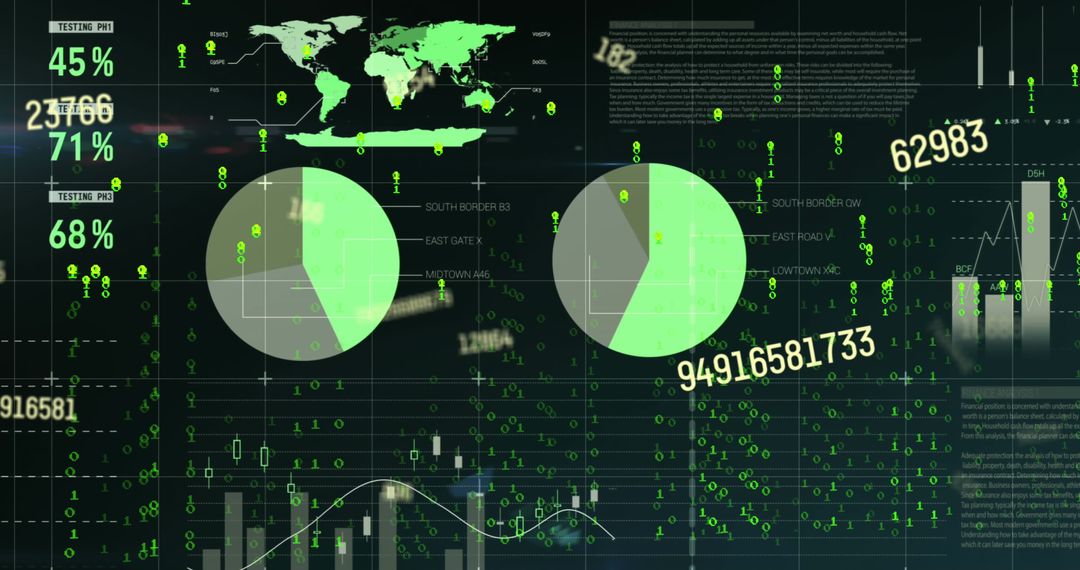
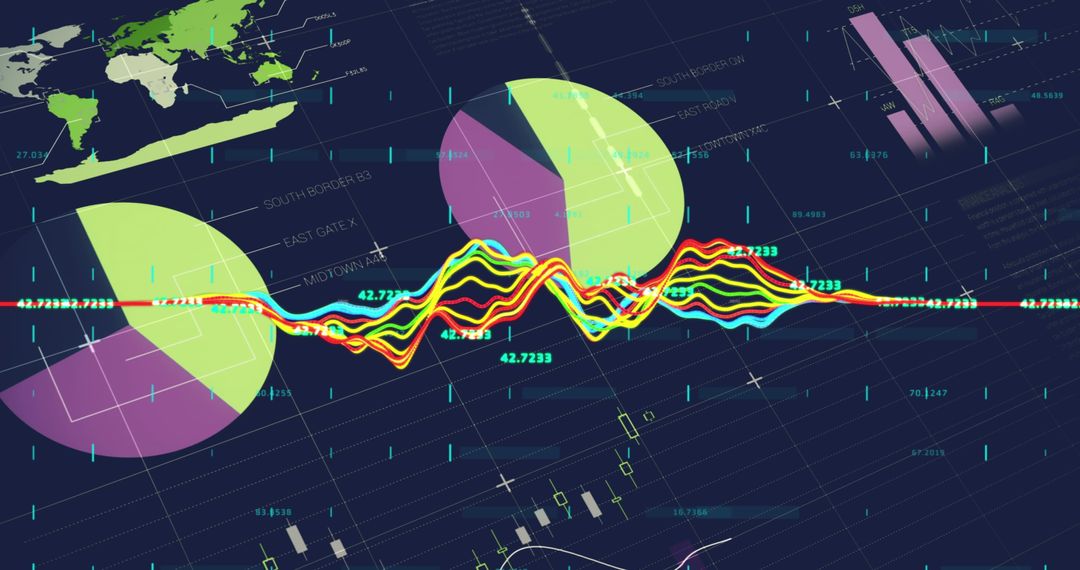
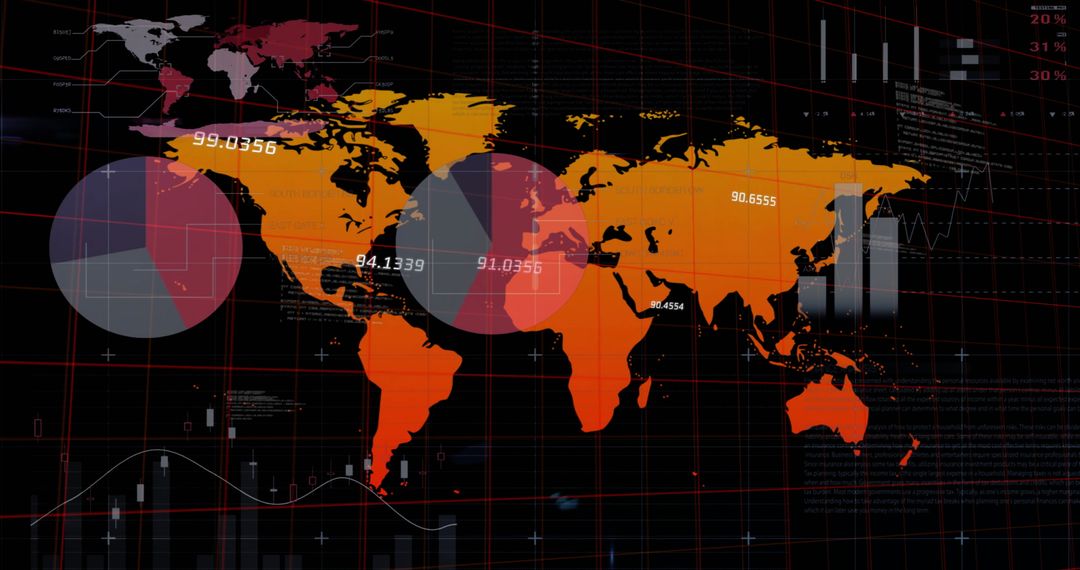
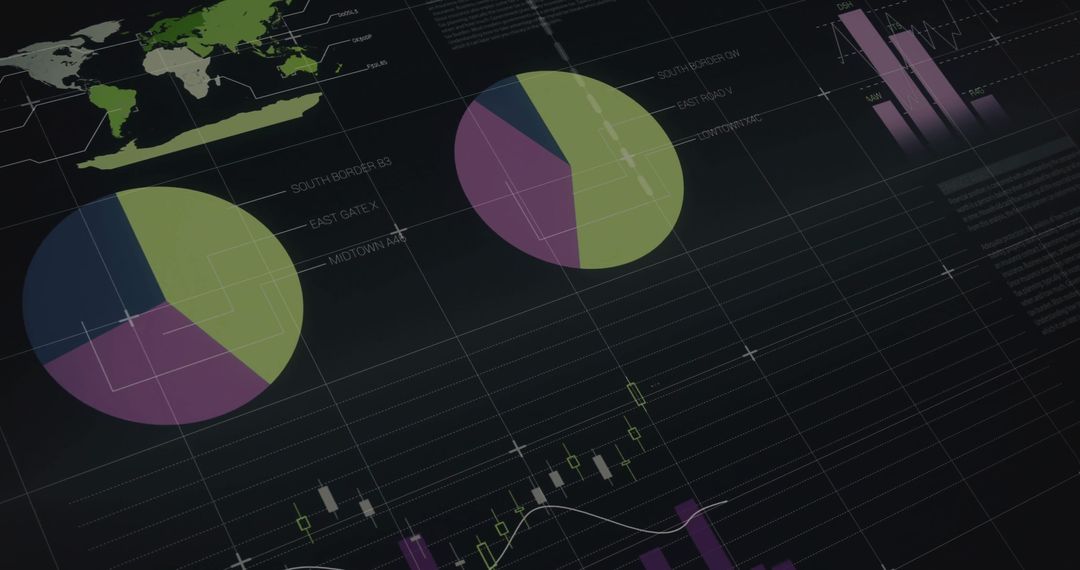
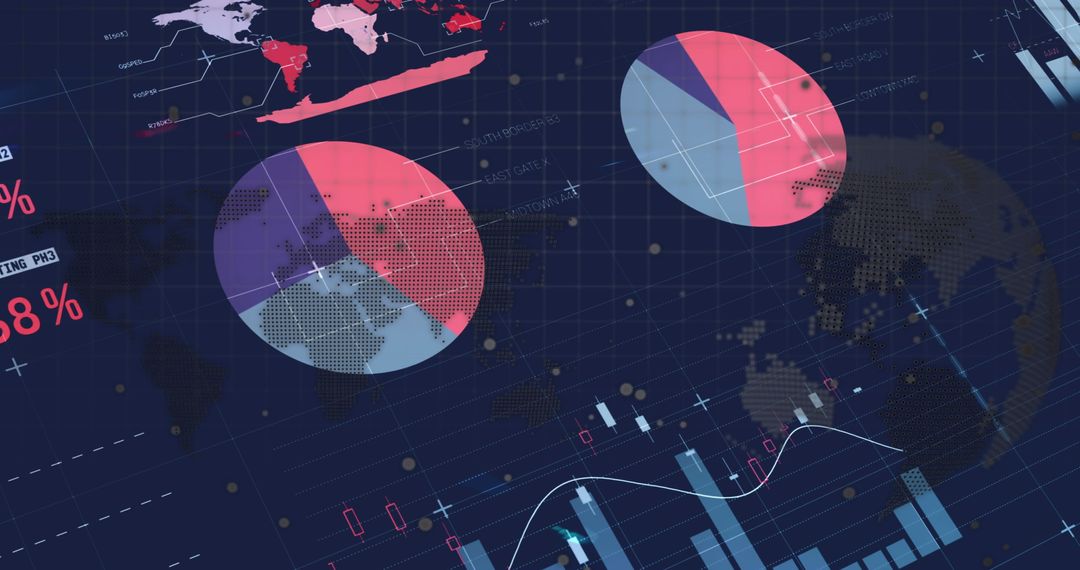
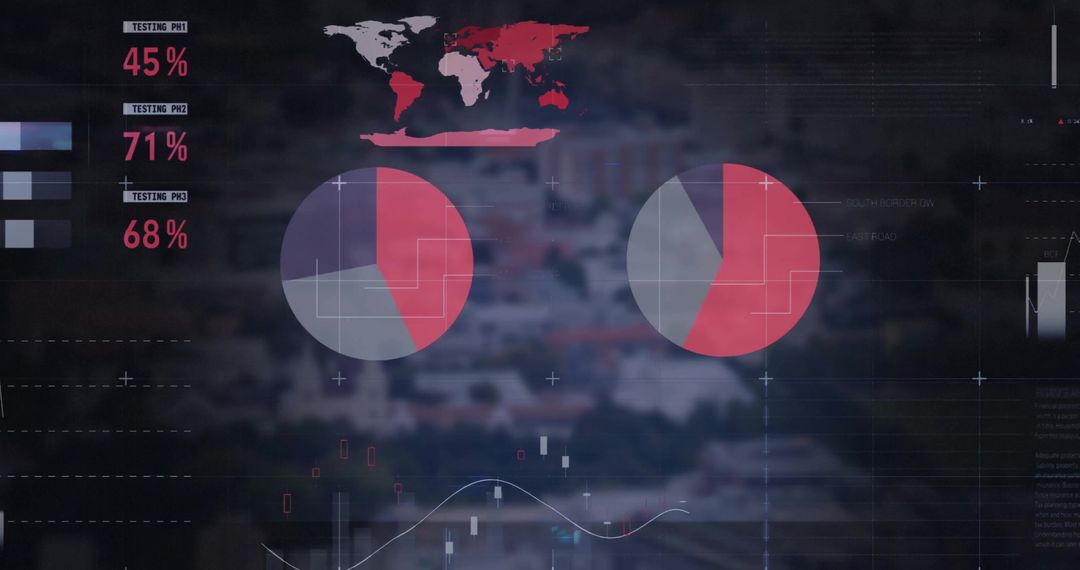
- Digital Financial Data Analytics with Pie Charts and Graphs
Digital Financial Data Analytics with Pie Charts and Graphs Image

This illustration depicts a complex array of digital financial data, including pie charts, bar graphs, and world map highlighting global finance and data analytics concepts. Useful for financial reports, presentations, and articles dealing with data analysis, economics, global markets, and stock market trends.
Powered by 


2
downloads
downloads
Tags:
More
Credit Photo
If you would like to credit the Photo, here are some ways you can do so
Text Link
photo Link
<span class="text-link">
<span>
<a target="_blank" href=https://pikwizard.com/photo/digital-financial-data-analytics-with-pie-charts-and-graphs/ed9171b98d4d2566ede28964c8dc3e91/>PikWizard</a>
</span>
</span>
<span class="image-link">
<span
style="margin: 0 0 20px 0; display: inline-block; vertical-align: middle; width: 100%;"
>
<a
target="_blank"
href="https://pikwizard.com/photo/digital-financial-data-analytics-with-pie-charts-and-graphs/ed9171b98d4d2566ede28964c8dc3e91/"
style="text-decoration: none; font-size: 10px; margin: 0;"
>
<img src="https://pikwizard.com/pw/medium/ed9171b98d4d2566ede28964c8dc3e91.jpg" style="margin: 0; width: 100%;" alt="" />
<p style="font-size: 12px; margin: 0;">PikWizard</p>
</a>
</span>
</span>
Free (free of charge)
Free for personal and commercial use.
Author: People Creations
Similar Free Stock Images

Premium


Premium


Premium


Premium


Premium


Premium


Premium


Premium


Premium


Premium


Premium


Premium


Premium


Premium


Premium


Premium


Premium


Premium


Premium


Premium

Premium


Premium


Premium


Premium