
- Home >
- Stock Photos >
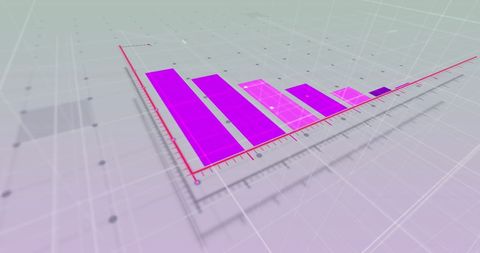
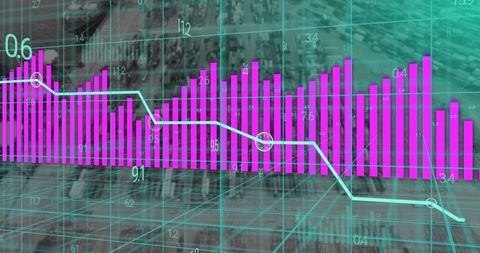
- Digital Financial Data Analytics with Vibrant 3D Graph
Digital Financial Data Analytics with Vibrant 3D Graph Image

This vibrant graphic visualizes financial data analytics through a 3D bar graph on a green background. The combination of purple bars and an abstract digital grid enhances the sense of advanced technological processing and data-oriented financial strategies. Suitable for illustrating concepts related to business growth, investments, finance technology, or economic forecasts. Effective in educational materials, presentations, financial report designs, and digital marketing campaigns within the tech-driven finance sector.
Powered by 


downloads
Tags:
More
Credit Photo
If you would like to credit the Photo, here are some ways you can do so
Text Link
photo Link
<span class="text-link">
<span>
<a target="_blank" href=https://pikwizard.com/photo/digital-financial-data-analytics-with-vibrant-3d-graph/d08f08155d2a3a6db9b26cce40a8ffe0/>PikWizard</a>
</span>
</span>
<span class="image-link">
<span
style="margin: 0 0 20px 0; display: inline-block; vertical-align: middle; width: 100%;"
>
<a
target="_blank"
href="https://pikwizard.com/photo/digital-financial-data-analytics-with-vibrant-3d-graph/d08f08155d2a3a6db9b26cce40a8ffe0/"
style="text-decoration: none; font-size: 10px; margin: 0;"
>
<img src="https://pikwizard.com/pw/medium/d08f08155d2a3a6db9b26cce40a8ffe0.jpg" style="margin: 0; width: 100%;" alt="" />
<p style="font-size: 12px; margin: 0;">PikWizard</p>
</a>
</span>
</span>
Free (free of charge)
Free for personal and commercial use.
Author: Creative Art
Similar Free Stock Images

Premium


Premium


Premium


Premium


Premium


Premium


Premium

Premium

Premium


Premium


Premium


Premium


Premium
Premium

Premium


Premium


Premium

Premium


Premium


Premium


Premium


Premium


Premium


Premium


Premium

Explore More Free Stock Images