
- Home >
- Stock Photos >
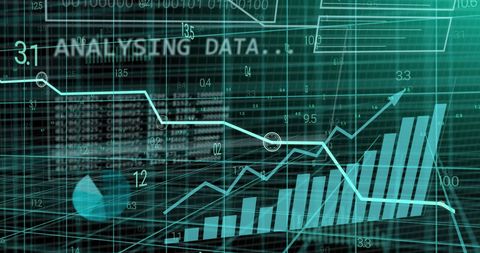
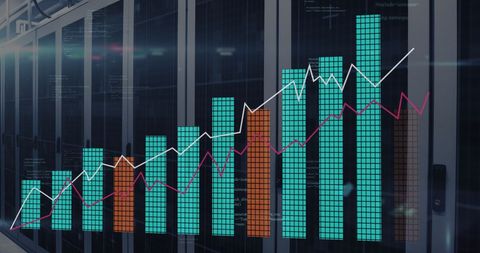
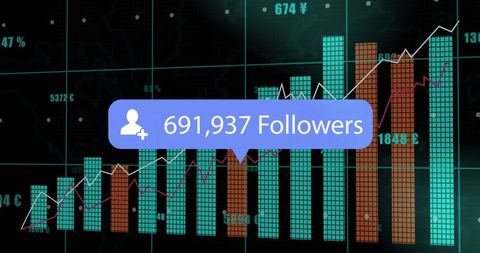
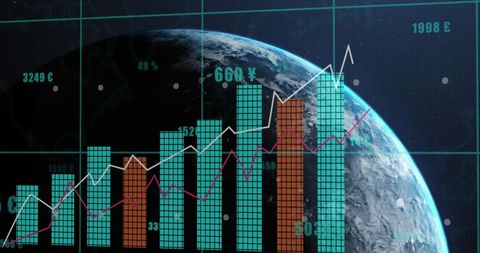
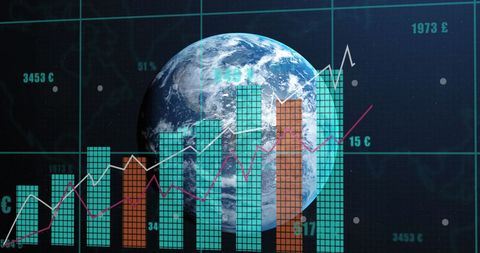
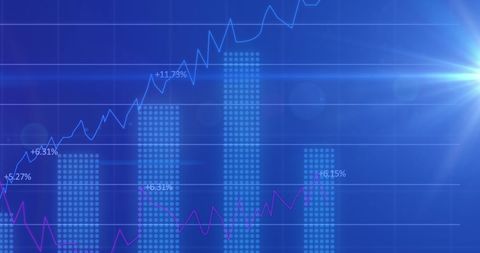
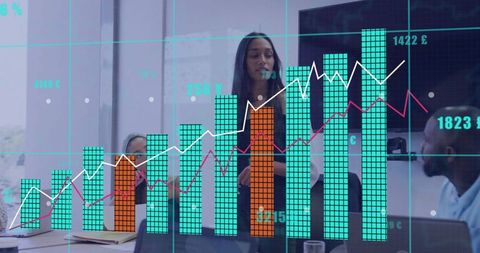
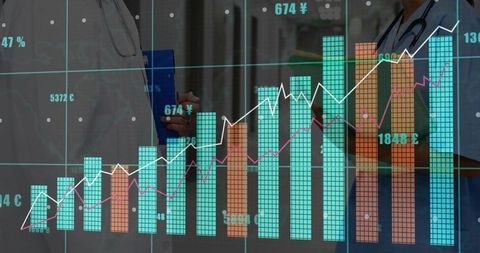
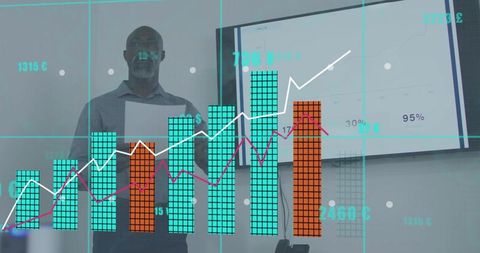
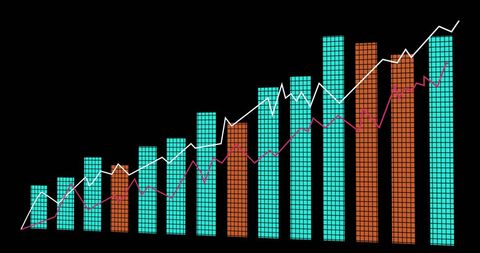
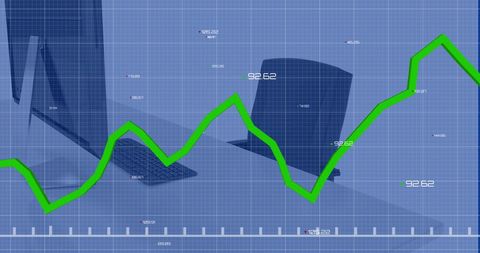
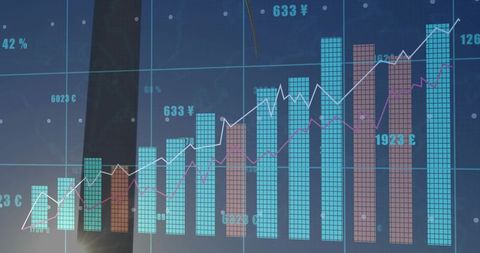
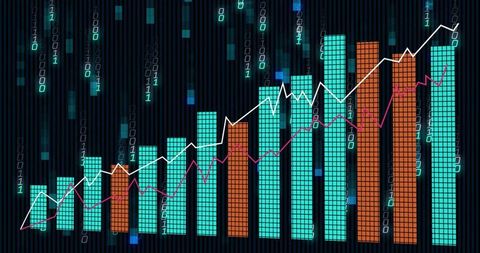
- Digital Financial Data Analyzing on Computer in Global Markets
Digital Financial Data Analyzing on Computer in Global Markets Image
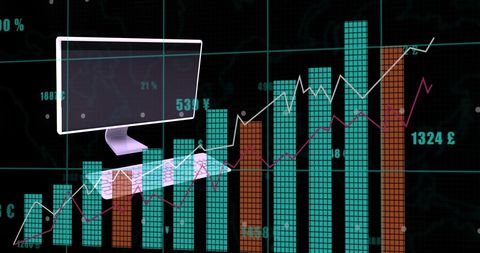
Visualization shows computer technology overlaid with digital financial graphs. Useful for illustrating concepts in finance, data analysis, global trading markets, or technology in international business. Ideal for presentations, reports, or articles about financial technology and market trends.
Powered by 


downloads
Tags:
More
Credit Photo
If you would like to credit the Photo, here are some ways you can do so
Text Link
photo Link
<span class="text-link">
<span>
<a target="_blank" href=https://pikwizard.com/photo/digital-financial-data-analyzing-on-computer-in-global-markets/e1dd44ac32ebe4100f16f3a40bfabdbc/>PikWizard</a>
</span>
</span>
<span class="image-link">
<span
style="margin: 0 0 20px 0; display: inline-block; vertical-align: middle; width: 100%;"
>
<a
target="_blank"
href="https://pikwizard.com/photo/digital-financial-data-analyzing-on-computer-in-global-markets/e1dd44ac32ebe4100f16f3a40bfabdbc/"
style="text-decoration: none; font-size: 10px; margin: 0;"
>
<img src="https://pikwizard.com/pw/medium/e1dd44ac32ebe4100f16f3a40bfabdbc.jpg" style="margin: 0; width: 100%;" alt="" />
<p style="font-size: 12px; margin: 0;">PikWizard</p>
</a>
</span>
</span>
Free (free of charge)
Free for personal and commercial use.
Author: Authentic Images
Similar Free Stock Images
Premium

Premium


Premium


Premium


Premium


Premium

Premium


Premium

Premium


Premium


Premium
Premium


Premium


Premium


Premium


Premium


Premium

Premium


Premium


Premium


Premium


Premium


Premium


Premium


Premium

Explore More Free Stock Images