
- Home >
- Stock Photos >
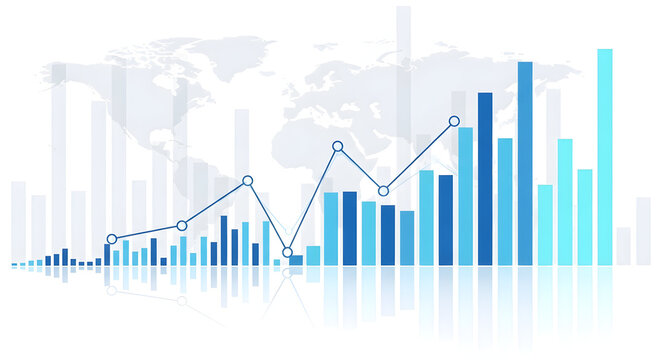
- Digital Financial Data and Analysis with Graphs
Digital Financial Data and Analysis with Graphs Image

Abstract composition of financial data being processed with digital charts, highlighting concepts in both business and technology fields. Suitable for illustrating articles about fintech developments, business intelligence, economic analysis, or finance education materials.
Powered by 


downloads
Tags:
More
Credit Photo
If you would like to credit the Photo, here are some ways you can do so
Text Link
photo Link
<span class="text-link">
<span>
<a target="_blank" href=https://pikwizard.com/photo/digital-financial-data-and-analysis-with-graphs/5c273c6de8a2ce3cc4314cf5d6556fa4/>PikWizard</a>
</span>
</span>
<span class="image-link">
<span
style="margin: 0 0 20px 0; display: inline-block; vertical-align: middle; width: 100%;"
>
<a
target="_blank"
href="https://pikwizard.com/photo/digital-financial-data-and-analysis-with-graphs/5c273c6de8a2ce3cc4314cf5d6556fa4/"
style="text-decoration: none; font-size: 10px; margin: 0;"
>
<img src="https://pikwizard.com/pw/medium/5c273c6de8a2ce3cc4314cf5d6556fa4.jpg" style="margin: 0; width: 100%;" alt="" />
<p style="font-size: 12px; margin: 0;">PikWizard</p>
</a>
</span>
</span>
Free (free of charge)
Free for personal and commercial use.
Author: Authentic Images
Similar Free Stock Images

Premium


Premium

Premium


Premium


Premium


Premium


Premium


Premium
Premium

Premium

Premium


Premium


Premium


Premium


Premium


Premium


Premium


Premium

Premium


Premium


Premium

Premium


Premium


Premium


Premium
Explore More Free Stock Images