- Home >
- Stock Photos >
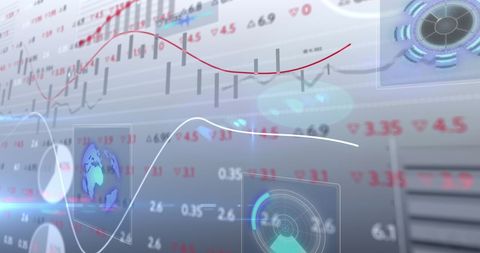
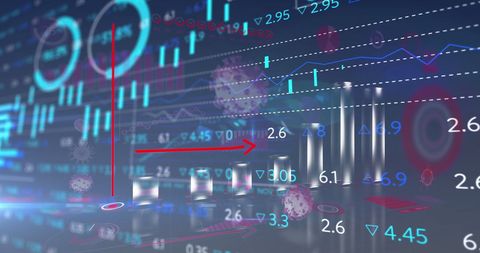
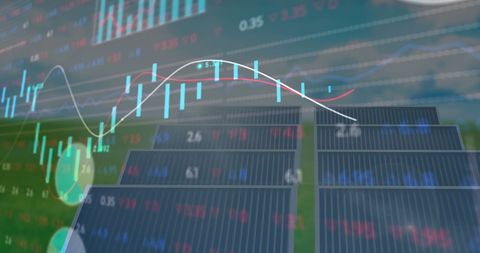
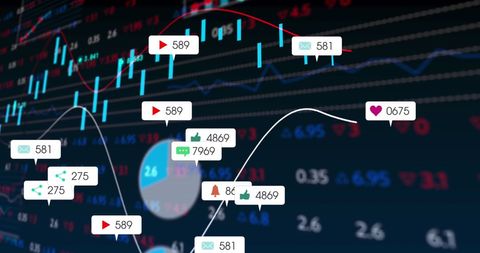
- Digital Financial Data and Graph Analysis
Digital Financial Data and Graph Analysis Image

This image of numbers and graphs on a digital screen illustrates global financial trends and data analytics. Ideal for use in articles or presentations relating to finance, stock trading, economic reports, business technology, and financial analysis.

downloads
Tags:
More
Credit Photo
If you would like to credit the Photo, here are some ways you can do so
Text Link
photo Link
<span class="text-link">
<span>
<a target="_blank" href=https://pikwizard.com/photo/digital-financial-data-and-graph-analysis/7bc596f9305ce7e2da840b3ae1dffec8/>PikWizard</a>
</span>
</span>
<span class="image-link">
<span
style="margin: 0 0 20px 0; display: inline-block; vertical-align: middle; width: 100%;"
>
<a
target="_blank"
href="https://pikwizard.com/photo/digital-financial-data-and-graph-analysis/7bc596f9305ce7e2da840b3ae1dffec8/"
style="text-decoration: none; font-size: 10px; margin: 0;"
>
<img src="https://pikwizard.com/pw/medium/7bc596f9305ce7e2da840b3ae1dffec8.jpg" style="margin: 0; width: 100%;" alt="" />
<p style="font-size: 12px; margin: 0;">PikWizard</p>
</a>
</span>
</span>
Free (free of charge)
Free for personal and commercial use.
Author: People Creations