
- Home >
- Stock Photos >
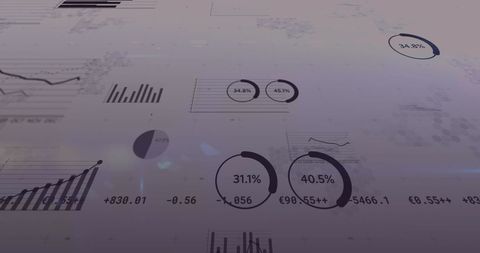
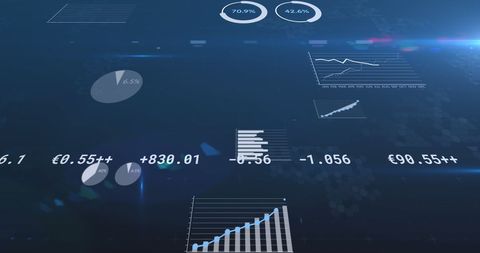
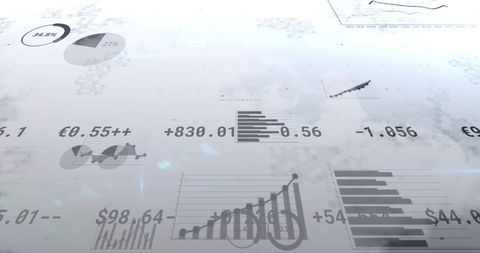
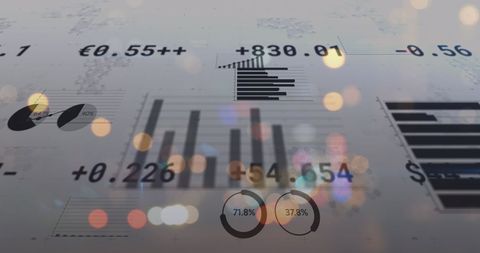
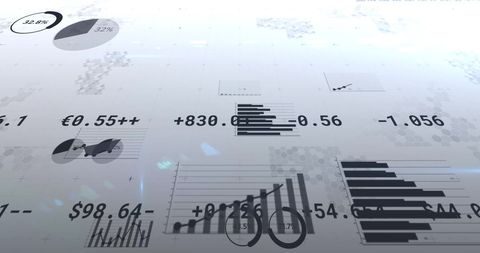
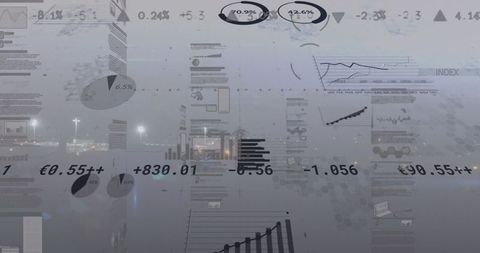
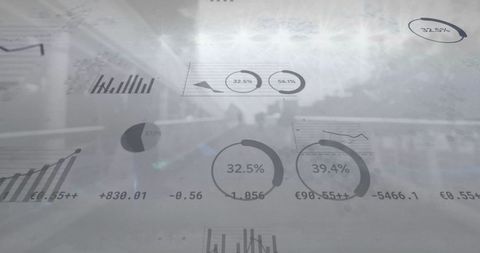
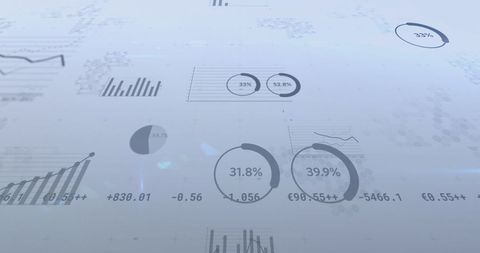
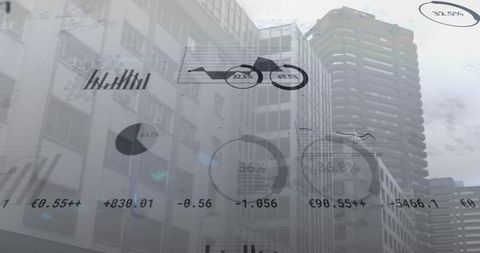
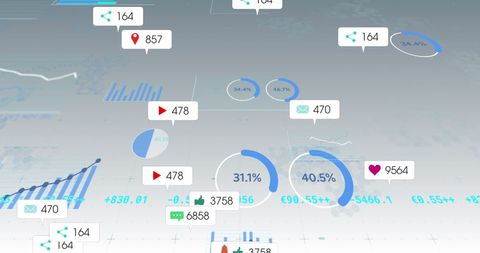
- Digital Financial Data and Graph Visuals with Modern Design
Digital Financial Data and Graph Visuals with Modern Design Image
Financial charts and graphs presented on a grey background suggest a focus on global business, economic analysis, and technology-driven data presentation. Useful for illustrating financial reports, business strategy documents, economic research papers, or in presentations on technological solutions in finance.
Powered by  - Get 15% off with code: PIKWIZARD15


downloads
Tags:
More
Credit Photo
If you would like to credit the Photo, here are some ways you can do so
Text Link
photo Link
<span class="text-link">
<span>
<a target="_blank" href=https://pikwizard.com/photo/digital-financial-data-and-graph-visuals-with-modern-design/4ea17a4cf948be6d041d4e076f66aed8/>PikWizard</a>
</span>
</span>
<span class="image-link">
<span
style="margin: 0 0 20px 0; display: inline-block; vertical-align: middle; width: 100%;"
>
<a
target="_blank"
href="https://pikwizard.com/photo/digital-financial-data-and-graph-visuals-with-modern-design/4ea17a4cf948be6d041d4e076f66aed8/"
style="text-decoration: none; font-size: 10px; margin: 0;"
>
<img src="https://pikwizard.com/pw/medium/4ea17a4cf948be6d041d4e076f66aed8.jpg" style="margin: 0; width: 100%;" alt="" />
<p style="font-size: 12px; margin: 0;">PikWizard</p>
</a>
</span>
</span>
Free (free of charge)
Free for personal and commercial use.
Author: Awesome Content
Similar Free Stock Images
Premium


Premium

Premium


Premium


Premium


Premium


Premium


Premium


Premium


Premium

Premium


Premium

Premium


Premium


Premium


Premium


Premium


Premium


Premium

Premium


Premium


Premium


Premium

Premium


Premium


Explore More Free Stock Images