- Home >
- Stock Photos >
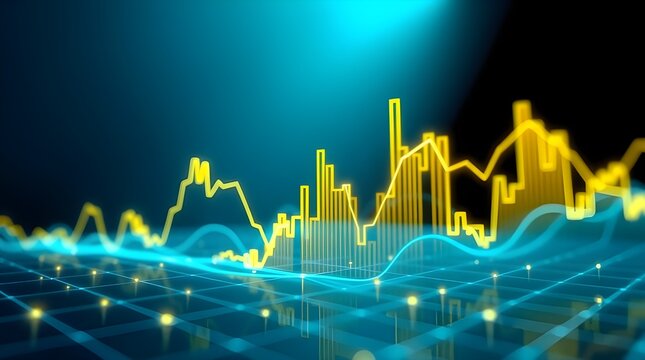
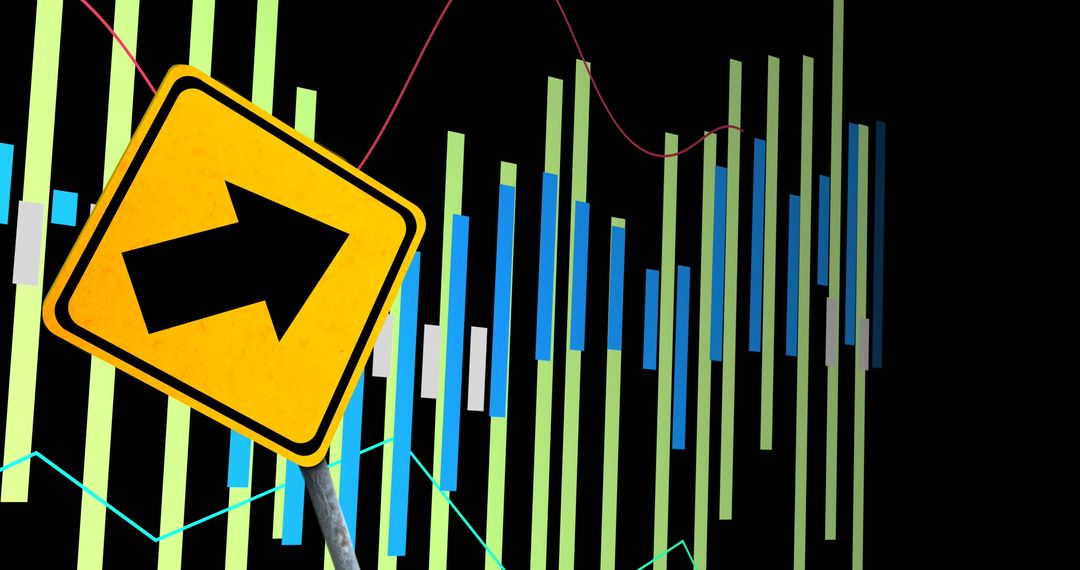
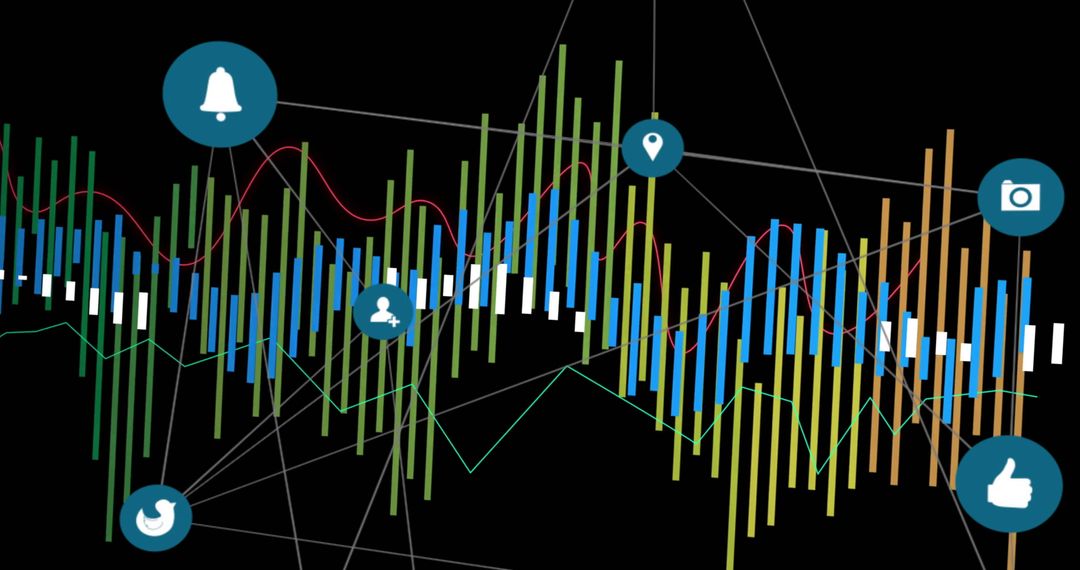
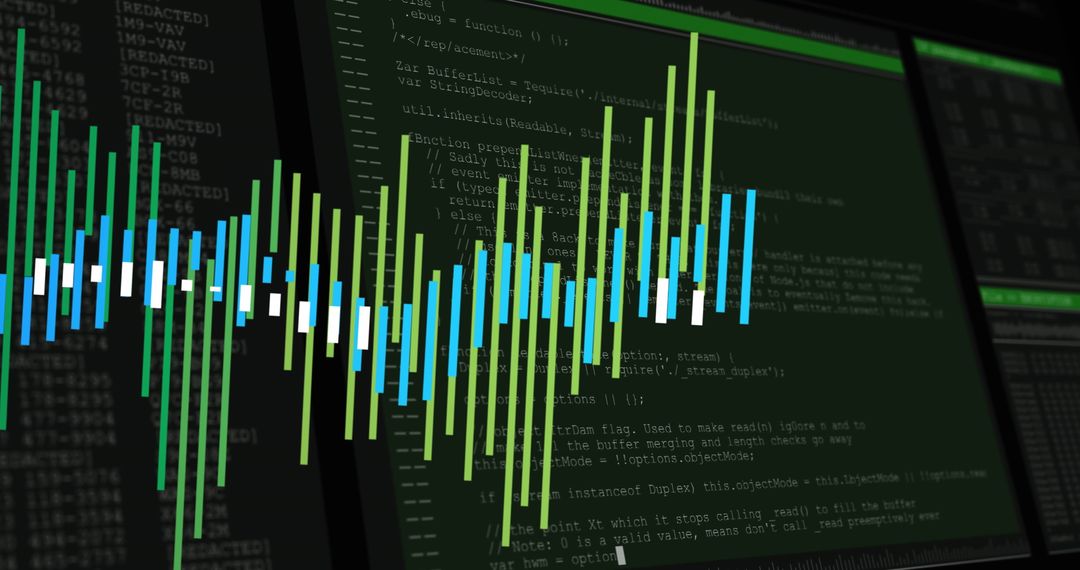
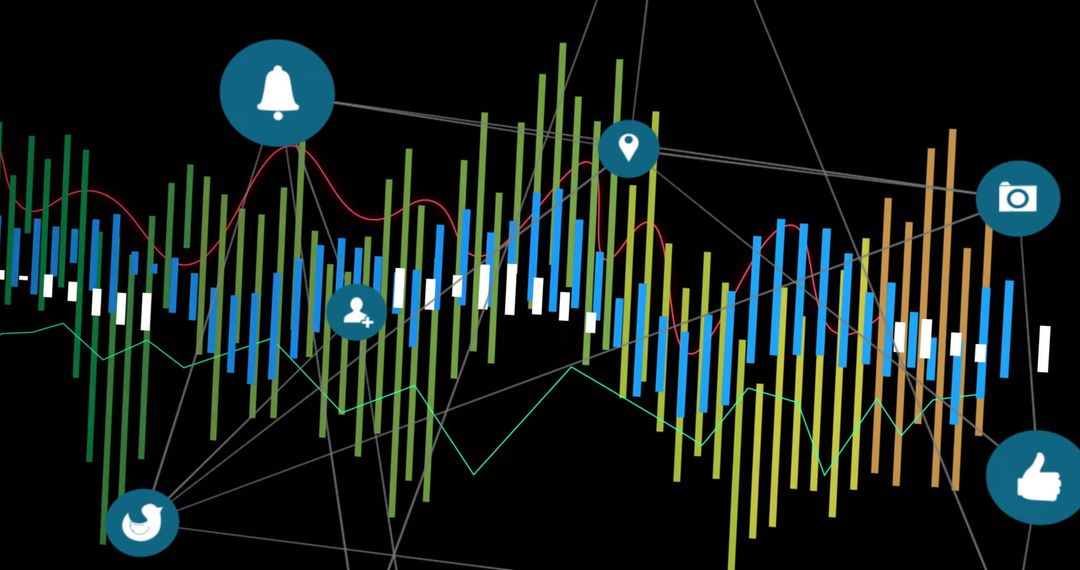
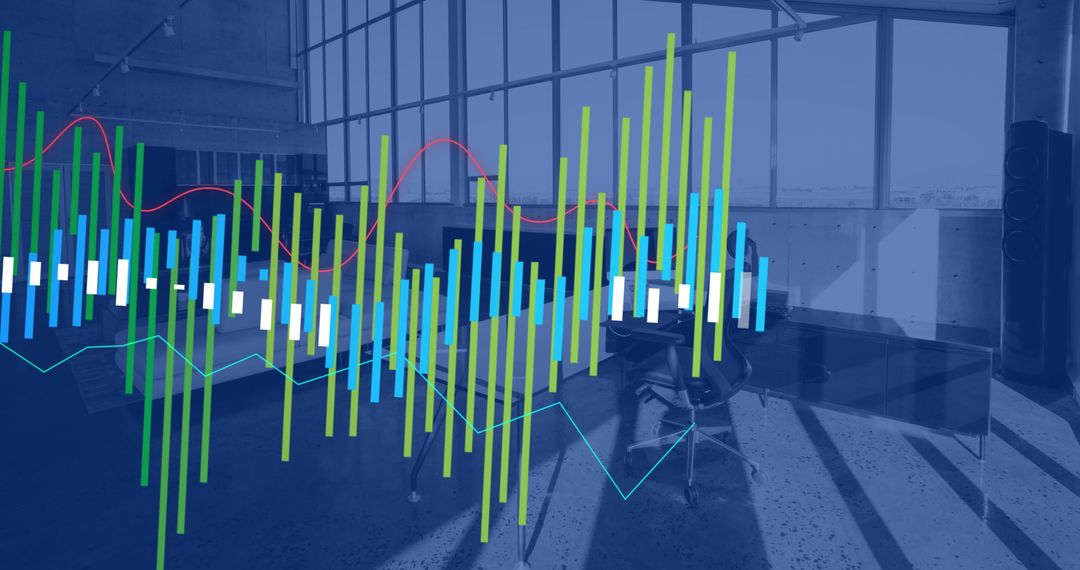
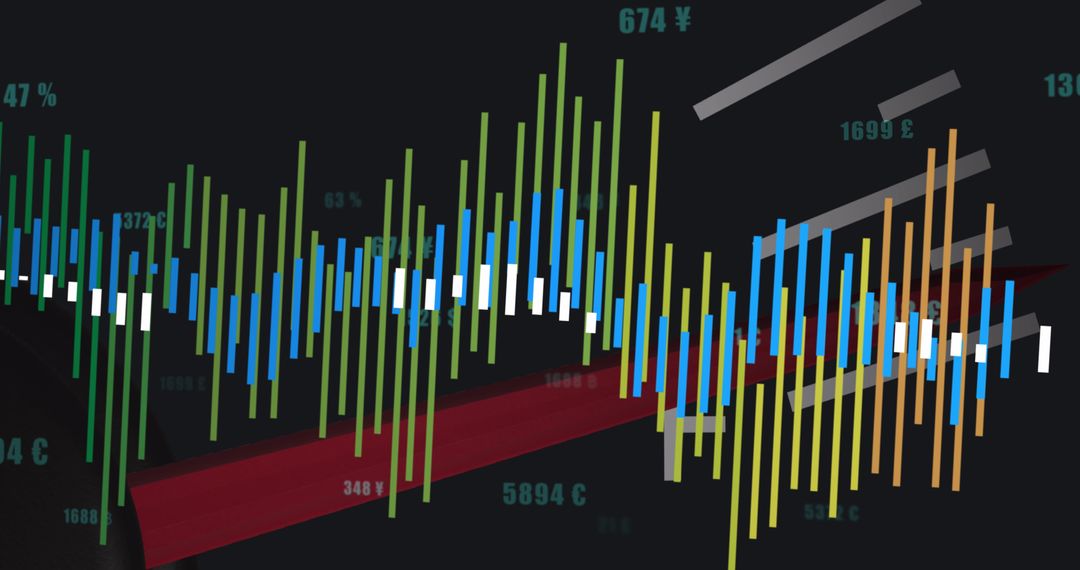
- Digital Financial Data and Market Trends Analysis on Black Background
Digital Financial Data and Market Trends Analysis on Black Background Image

Abstract representation of financial data processing with colorful bar charts against a black background. Infographics convey global market trends and analysis, suitable for illustrating concepts of business finance and technological innovation. Ideal for use in business presentations, digital platforms, economic studies, and online articles about global market dynamics.
Powered by 


2
downloads
downloads
Tags:
More
Credit Photo
If you would like to credit the Photo, here are some ways you can do so
Text Link
photo Link
<span class="text-link">
<span>
<a target="_blank" href=https://pikwizard.com/photo/digital-financial-data-and-market-trends-analysis-on-black-background/e8e68ba38c9ea5fbfe03e10d3b8bb40d/>PikWizard</a>
</span>
</span>
<span class="image-link">
<span
style="margin: 0 0 20px 0; display: inline-block; vertical-align: middle; width: 100%;"
>
<a
target="_blank"
href="https://pikwizard.com/photo/digital-financial-data-and-market-trends-analysis-on-black-background/e8e68ba38c9ea5fbfe03e10d3b8bb40d/"
style="text-decoration: none; font-size: 10px; margin: 0;"
>
<img src="https://pikwizard.com/pw/medium/e8e68ba38c9ea5fbfe03e10d3b8bb40d.jpg" style="margin: 0; width: 100%;" alt="" />
<p style="font-size: 12px; margin: 0;">PikWizard</p>
</a>
</span>
</span>
Free (free of charge)
Free for personal and commercial use.
Author: Creative Art
Similar Free Stock Images

Premium


Premium


Premium


Premium


Premium


Premium


Premium


Premium


Premium


Premium


Premium


Premium


Premium


Premium


Premium


Premium


Premium


Premium


Premium


Premium


Premium


Premium


Premium


Premium