- Home >
- Stock Photos >
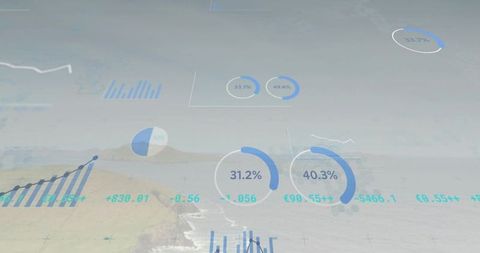
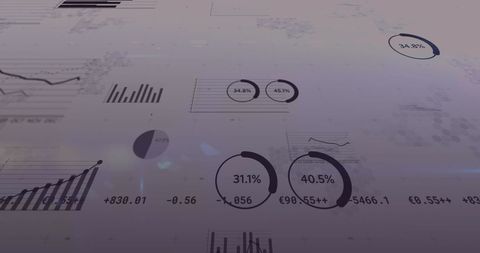
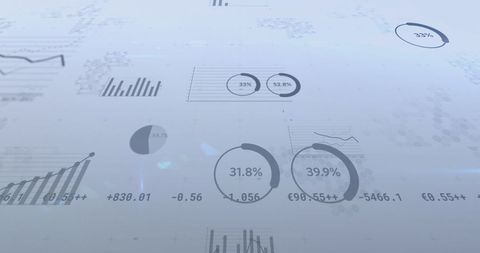
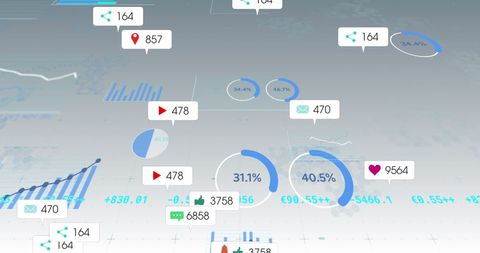
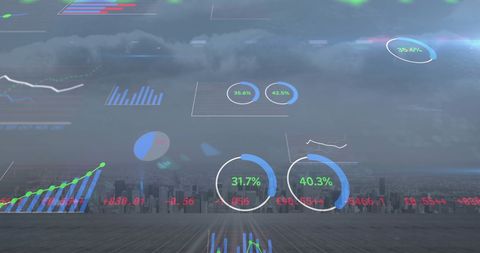
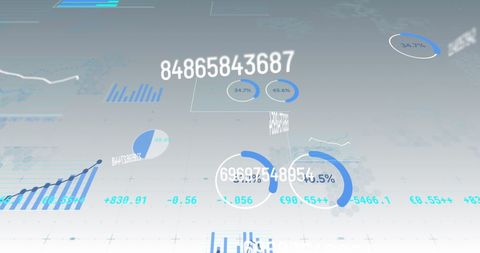
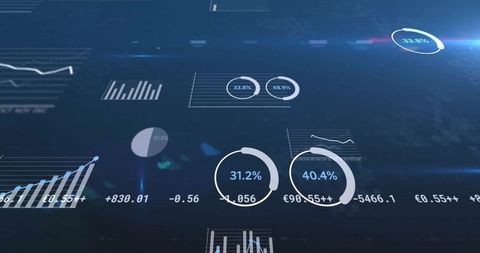
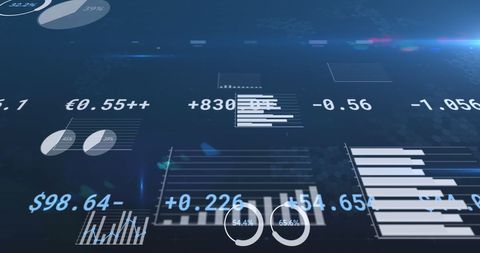
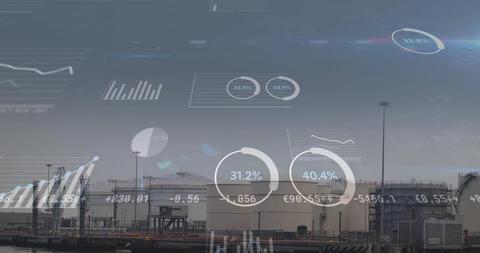
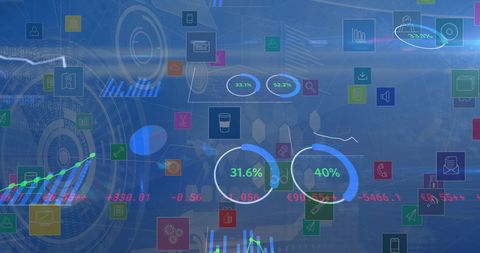
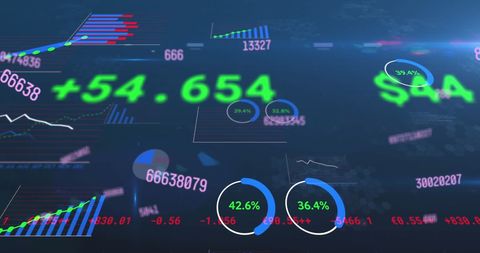
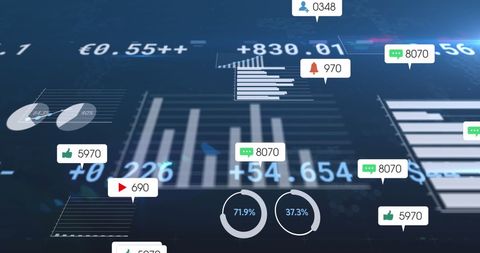
- Digital Financial Data and Statistics Analysis
Digital Financial Data and Statistics Analysis Image
Representation of digital financial analysis with dynamic graphs and statistics on a virtual screen. Perfect for illustrating concepts of business finance, data analytics, and modern technology influence on financial markets.

downloads
Tags:
More
Credit Photo
If you would like to credit the Photo, here are some ways you can do so
Text Link
photo Link
<span class="text-link">
<span>
<a target="_blank" href=https://pikwizard.com/photo/digital-financial-data-and-statistics-analysis/1f9ec4388fe6086f8f07270a42da2002/>PikWizard</a>
</span>
</span>
<span class="image-link">
<span
style="margin: 0 0 20px 0; display: inline-block; vertical-align: middle; width: 100%;"
>
<a
target="_blank"
href="https://pikwizard.com/photo/digital-financial-data-and-statistics-analysis/1f9ec4388fe6086f8f07270a42da2002/"
style="text-decoration: none; font-size: 10px; margin: 0;"
>
<img src="https://pikwizard.com/pw/medium/1f9ec4388fe6086f8f07270a42da2002.jpg" style="margin: 0; width: 100%;" alt="" />
<p style="font-size: 12px; margin: 0;">PikWizard</p>
</a>
</span>
</span>
Free (free of charge)
Free for personal and commercial use.
Author: People Creations