
- Home >
- Stock Photos >
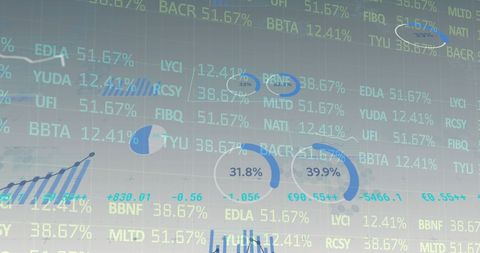
- Digital Financial Data and Statistics Representation
Digital Financial Data and Statistics Representation Image

Visual capturing compiled digital statistics and finance-related graphs overlaid on transparent background. Suitable for depicting global business concepts, economic trend analysis, company presentations, and educational materials on financial data management. Ideal for illustrating technology-driven financial strategies.
Powered by 


downloads
Tags:
More
Credit Photo
If you would like to credit the Photo, here are some ways you can do so
Text Link
photo Link
<span class="text-link">
<span>
<a target="_blank" href=https://pikwizard.com/photo/digital-financial-data-and-statistics-representation/8e5fbe89267847ba8cbc9a93f8917b6e/>PikWizard</a>
</span>
</span>
<span class="image-link">
<span
style="margin: 0 0 20px 0; display: inline-block; vertical-align: middle; width: 100%;"
>
<a
target="_blank"
href="https://pikwizard.com/photo/digital-financial-data-and-statistics-representation/8e5fbe89267847ba8cbc9a93f8917b6e/"
style="text-decoration: none; font-size: 10px; margin: 0;"
>
<img src="https://pikwizard.com/pw/medium/8e5fbe89267847ba8cbc9a93f8917b6e.jpg" style="margin: 0; width: 100%;" alt="" />
<p style="font-size: 12px; margin: 0;">PikWizard</p>
</a>
</span>
</span>
Free (free of charge)
Free for personal and commercial use.
Author: Awesome Content
Similar Free Stock Images

Premium


Premium

Premium

Premium

Premium


Premium


Premium


Premium


Premium


Premium


Premium


Premium


Premium


Premium

Premium


Premium

Premium

Premium


Premium


Premium


Premium

Premium


Premium


Premium


Premium


Explore More Free Stock Images