
- Home >
- Stock Photos >
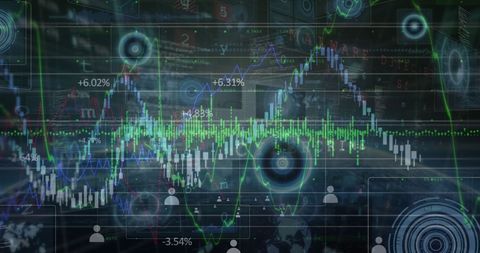
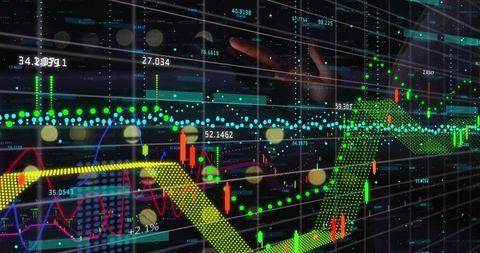
- Digital Financial Data and Technology Visualization
Digital Financial Data and Technology Visualization Image

Digital interface with complex graphs, charts, binary codes and financial statistics represents the merging of finance and technology. Useful for illustrating themes related to blockchain, financial analysis, fintech applications or presentations about trends in modern configurations of the economy and trading systems.
Powered by  - Get 15% off with code: PIKWIZARD15


downloads
Tags:
More
Credit Photo
If you would like to credit the Photo, here are some ways you can do so
Text Link
photo Link
<span class="text-link">
<span>
<a target="_blank" href=https://pikwizard.com/photo/digital-financial-data-and-technology-visualization/289f0117d1afaa41fe3e712c2e3feb8b/>PikWizard</a>
</span>
</span>
<span class="image-link">
<span
style="margin: 0 0 20px 0; display: inline-block; vertical-align: middle; width: 100%;"
>
<a
target="_blank"
href="https://pikwizard.com/photo/digital-financial-data-and-technology-visualization/289f0117d1afaa41fe3e712c2e3feb8b/"
style="text-decoration: none; font-size: 10px; margin: 0;"
>
<img src="https://pikwizard.com/pw/medium/289f0117d1afaa41fe3e712c2e3feb8b.jpg" style="margin: 0; width: 100%;" alt="" />
<p style="font-size: 12px; margin: 0;">PikWizard</p>
</a>
</span>
</span>
Free (free of charge)
Free for personal and commercial use.
Author: Awesome Content
Similar Free Stock Images

Premium


Premium


Premium

Premium
Premium

Premium


Premium

Premium

Premium

Premium


Premium


Premium


Premium


Premium

Premium

Premium
Premium


Premium


Premium


Premium


Premium


Premium

Premium


Premium


Premium

Explore More Free Stock Images