
- Home >
- Stock Photos >
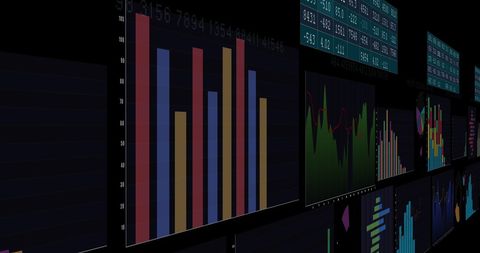
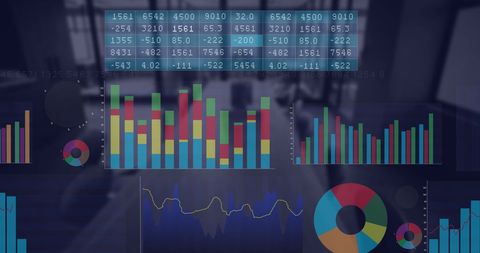
- Digital Financial Data Chart Visualization in Blue Tones
Digital Financial Data Chart Visualization in Blue Tones Image
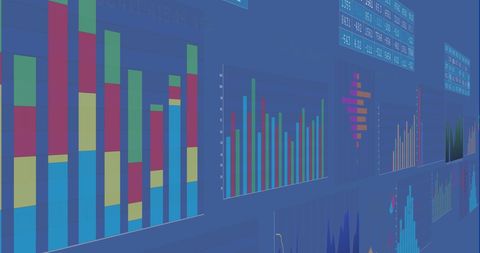
Brightly colored charts displaying a range of financial data presented over a blue background create a digital virtual databank that signifies modern business finance and performance analysis. Images like this can be used as powerful visuals in financial presentations, economic predictions, data analysis workshops, or digital backgrounds dedicated to finance news, technology updates or corporate websites showcasing innovation in analytics and systems.
Powered by  - Get 15% off with code: PIKWIZARD15


downloads
Tags:
More
Credit Photo
If you would like to credit the Photo, here are some ways you can do so
Text Link
photo Link
<span class="text-link">
<span>
<a target="_blank" href=https://pikwizard.com/photo/digital-financial-data-chart-visualization-in-blue-tones/6e1dbac53d4aa033364dfe75ff66c441/>PikWizard</a>
</span>
</span>
<span class="image-link">
<span
style="margin: 0 0 20px 0; display: inline-block; vertical-align: middle; width: 100%;"
>
<a
target="_blank"
href="https://pikwizard.com/photo/digital-financial-data-chart-visualization-in-blue-tones/6e1dbac53d4aa033364dfe75ff66c441/"
style="text-decoration: none; font-size: 10px; margin: 0;"
>
<img src="https://pikwizard.com/pw/medium/6e1dbac53d4aa033364dfe75ff66c441.jpg" style="margin: 0; width: 100%;" alt="" />
<p style="font-size: 12px; margin: 0;">PikWizard</p>
</a>
</span>
</span>
Free (free of charge)
Free for personal and commercial use.
Author: Awesome Content
Similar Free Stock Images

Premium


Premium


Premium


Premium


Premium

Premium


Premium

Premium


Premium


Premium


Premium


Premium

Premium

Premium


Premium


Premium

Premium


Premium


Premium


Premium

Premium


Premium

Premium


Premium


Premium


Explore More Free Stock Images