
- Home >
- Stock Photos >
- Digital Financial Data Chart with Candlestick Line on Blue Grid
Digital Financial Data Chart with Candlestick Line on Blue Grid Image
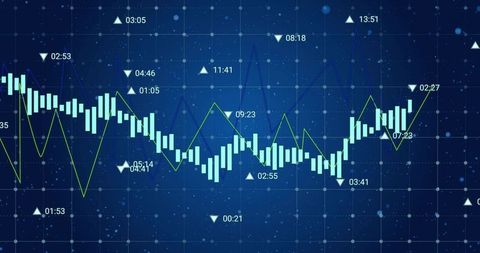
Illustration shows dynamic financial data presentation, making it ideal for corporate presentations, educational materials on market analysis, or reports related to blockchain, cryptocurrencies, and investment strategies. The use of time markers, grid platform, and emphasis on trends attract those interested in sophisticated financial technology tools.
Powered by 


0
downloads
downloads
Tags:
More
Credit Photo
If you would like to credit the Photo, here are some ways you can do so
Text Link
photo Link
<span class="text-link">
<span>
<a target="_blank" href=https://pikwizard.com/photo/digital-financial-data-chart-with-candlestick-line-on-blue-grid/7781cba21a59e84277e33134d72a7b1c/>PikWizard</a>
</span>
</span>
<span class="image-link">
<span
style="margin: 0 0 20px 0; display: inline-block; vertical-align: middle; width: 100%;"
>
<a
target="_blank"
href="https://pikwizard.com/photo/digital-financial-data-chart-with-candlestick-line-on-blue-grid/7781cba21a59e84277e33134d72a7b1c/"
style="text-decoration: none; font-size: 10px; margin: 0;"
>
<img src="https://pikwizard.com/pw/medium/7781cba21a59e84277e33134d72a7b1c.jpg" style="margin: 0; width: 100%;" alt="" />
<p style="font-size: 12px; margin: 0;">PikWizard</p>
</a>
</span>
</span>
Free (free of charge)
Free for personal and commercial use.
Author: Creative Art