- Home >
- Stock Photos >
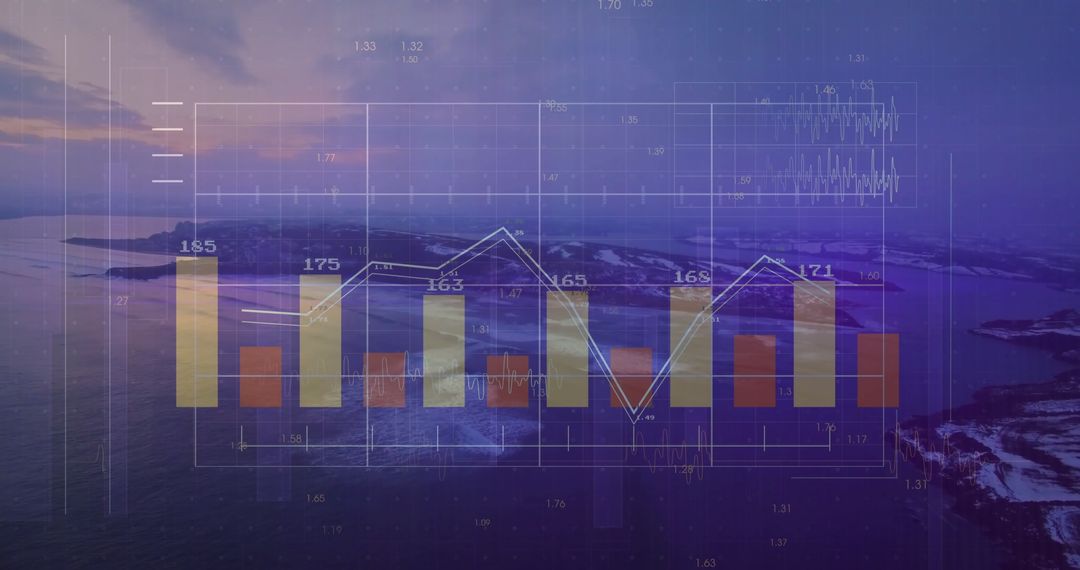
- Digital Financial Data Chart with Declining Trend over Blue Background
Digital Financial Data Chart with Declining Trend over Blue Background Image

A digital representation of financial data features prominently in this composition. Highlighting a series of declining red bars set against a blue backdrop, this concept captures a vivid visualization of a downward trend in the market. Its abstract nature and solid emphasis on numeric analysis make it struggle an ideal choice for publishers and educators looking to discuss stock market performance innovations in digital finance transformation or system dynamics presentations.
Powered by 


2
downloads
downloads
Tags:
More
Credit Photo
If you would like to credit the Photo, here are some ways you can do so
Text Link
photo Link
<span class="text-link">
<span>
<a target="_blank" href=https://pikwizard.com/photo/digital-financial-data-chart-with-declining-trend-over-blue-background/62a90ff01d3c49840275ca244d07e65d/>PikWizard</a>
</span>
</span>
<span class="image-link">
<span
style="margin: 0 0 20px 0; display: inline-block; vertical-align: middle; width: 100%;"
>
<a
target="_blank"
href="https://pikwizard.com/photo/digital-financial-data-chart-with-declining-trend-over-blue-background/62a90ff01d3c49840275ca244d07e65d/"
style="text-decoration: none; font-size: 10px; margin: 0;"
>
<img src="https://pikwizard.com/pw/medium/62a90ff01d3c49840275ca244d07e65d.jpg" style="margin: 0; width: 100%;" alt="" />
<p style="font-size: 12px; margin: 0;">PikWizard</p>
</a>
</span>
</span>
Free (free of charge)
Free for personal and commercial use.
Author: Creative Art
Similar Free Stock Images

Premium


Premium


Premium


Premium


Premium


Premium


Premium


Premium


Premium


Premium


Premium


Premium


Premium


Premium


Premium


Premium


Premium


Premium


Premium


Premium


Premium


Premium


Premium


Premium