- Home >
- Stock Photos >
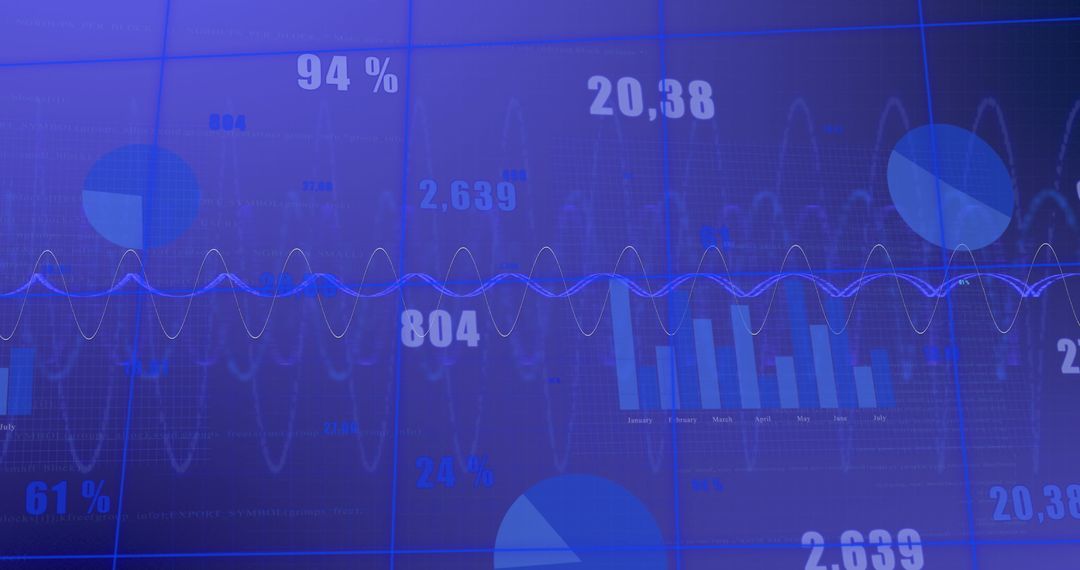
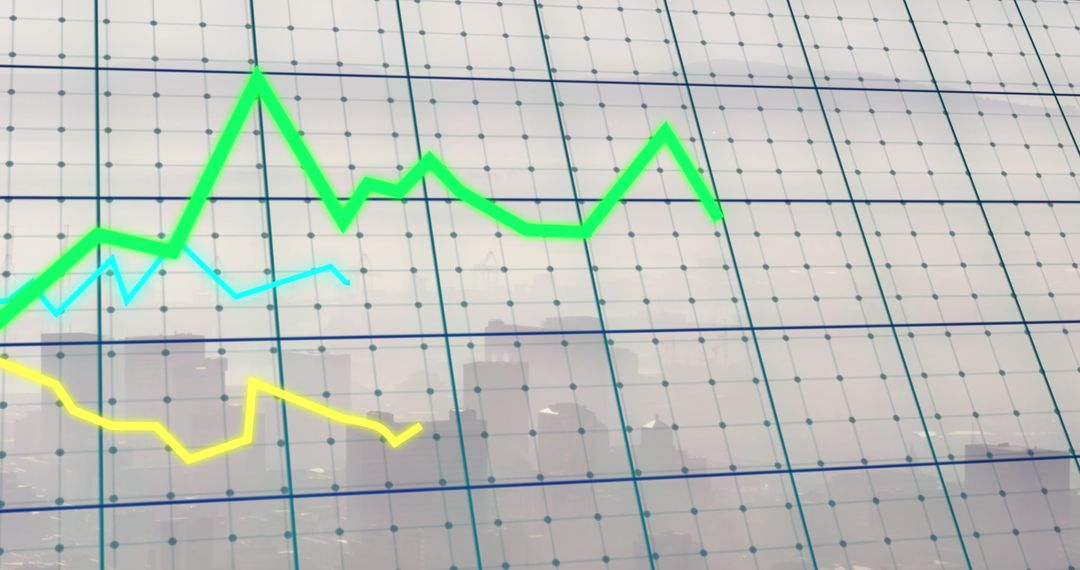
- Digital Financial Data Charts and Statistics Analysis
Digital Financial Data Charts and Statistics Analysis Image

Neon lines showing fluctuating data reflect financial statistics, suitable for illustrating concept of financial analysis or big data analytics. Useful for presentations about trade, economy projection, digital finance technologies, or educational tools centered around data interpretation.
Powered by 


2
downloads
downloads
Tags:
More
Credit Photo
If you would like to credit the Photo, here are some ways you can do so
Text Link
photo Link
<span class="text-link">
<span>
<a target="_blank" href=https://pikwizard.com/photo/digital-financial-data-charts-and-statistics-analysis/14cb86903bfb30d125b0afa2596584d7/>PikWizard</a>
</span>
</span>
<span class="image-link">
<span
style="margin: 0 0 20px 0; display: inline-block; vertical-align: middle; width: 100%;"
>
<a
target="_blank"
href="https://pikwizard.com/photo/digital-financial-data-charts-and-statistics-analysis/14cb86903bfb30d125b0afa2596584d7/"
style="text-decoration: none; font-size: 10px; margin: 0;"
>
<img src="https://pikwizard.com/pw/medium/14cb86903bfb30d125b0afa2596584d7.jpg" style="margin: 0; width: 100%;" alt="" />
<p style="font-size: 12px; margin: 0;">PikWizard</p>
</a>
</span>
</span>
Free (free of charge)
Free for personal and commercial use.
Author: People Creations
Similar Free Stock Images

Premium


Premium


Premium


Premium


Premium


Premium


Premium


Premium


Premium


Premium


Premium


Premium


Premium


Premium


Premium


Premium


Premium


Premium


Premium


Premium


Premium


Premium


Premium


Premium