
- Home >
- Stock Photos >
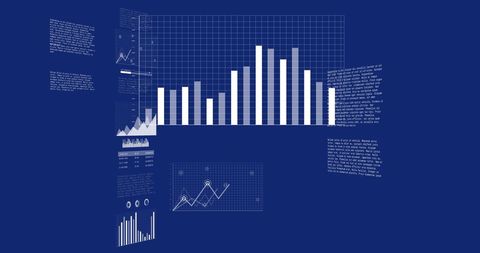
- Digital Financial Data Charts on Blue Background
Digital Financial Data Charts on Blue Background Image

Illustration of digital financial data charts, featuring a blue background with line and bar graphs depicting statistics and analysis. Useful for presentations on global finance, business strategy, economic studies or technology in data management. Ideal for websites, articles, or digital reports focusing on business analytics or data processing.
Powered by  - Get 15% off with code: PIKWIZARD15


downloads
Tags:
More
Credit Photo
If you would like to credit the Photo, here are some ways you can do so
Text Link
photo Link
<span class="text-link">
<span>
<a target="_blank" href=https://pikwizard.com/photo/digital-financial-data-charts-on-blue-background/1a67df20069cf936f8e1dd42efeda981/>PikWizard</a>
</span>
</span>
<span class="image-link">
<span
style="margin: 0 0 20px 0; display: inline-block; vertical-align: middle; width: 100%;"
>
<a
target="_blank"
href="https://pikwizard.com/photo/digital-financial-data-charts-on-blue-background/1a67df20069cf936f8e1dd42efeda981/"
style="text-decoration: none; font-size: 10px; margin: 0;"
>
<img src="https://pikwizard.com/pw/medium/1a67df20069cf936f8e1dd42efeda981.jpg" style="margin: 0; width: 100%;" alt="" />
<p style="font-size: 12px; margin: 0;">PikWizard</p>
</a>
</span>
</span>
Free (free of charge)
Free for personal and commercial use.
Author: People Creations
Similar Free Stock Images

Premium


Premium

Premium


Premium


Premium


Premium

Premium


Premium


Premium

Premium


Premium


Premium


Premium


Premium


Premium

Premium


Premium


Premium


Premium

Premium

Premium

Premium


Premium

Premium

Premium


Explore More Free Stock Images