- Home >
- Stock Photos >
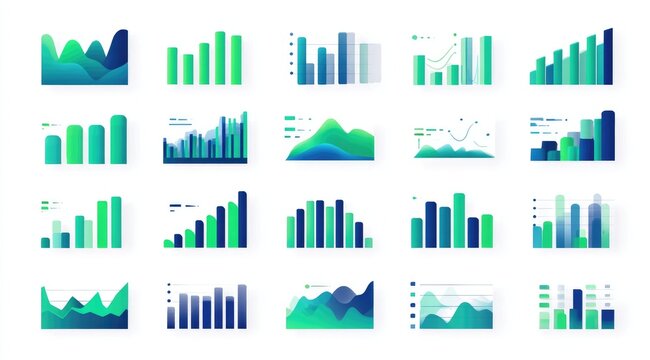
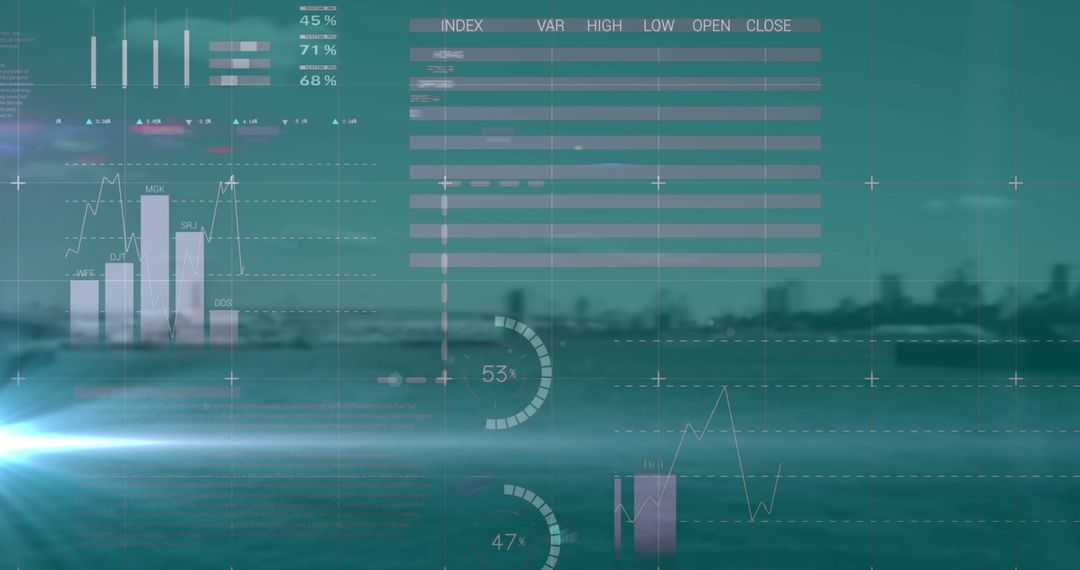
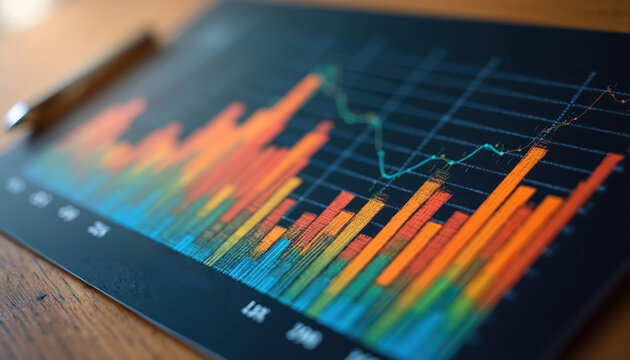
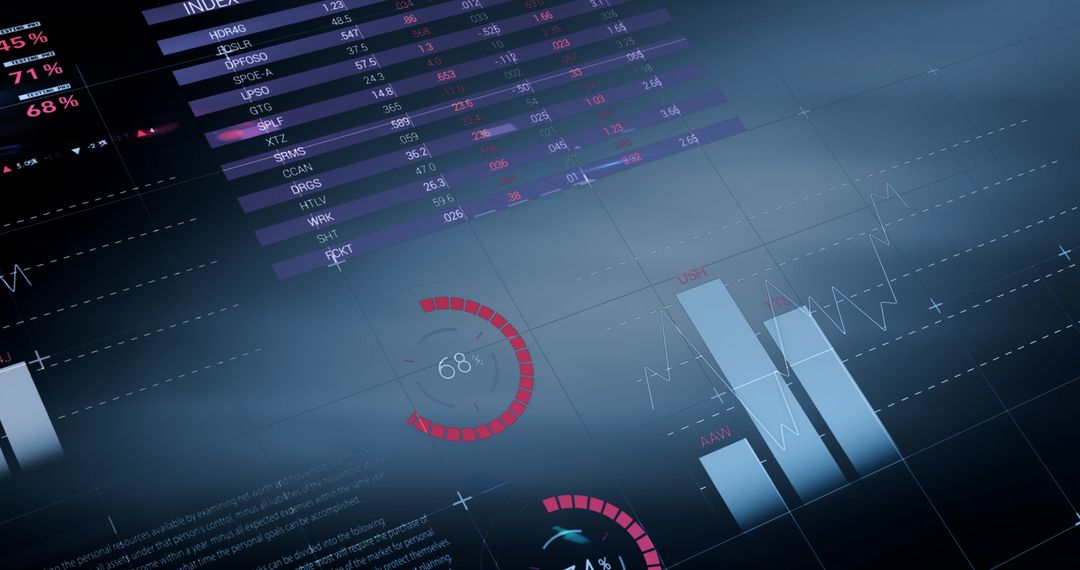
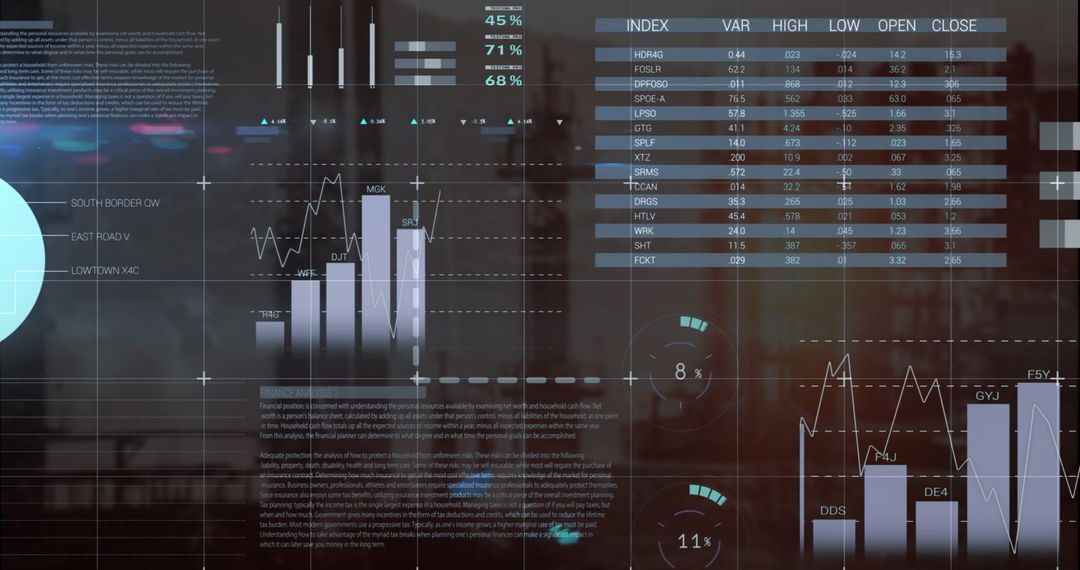
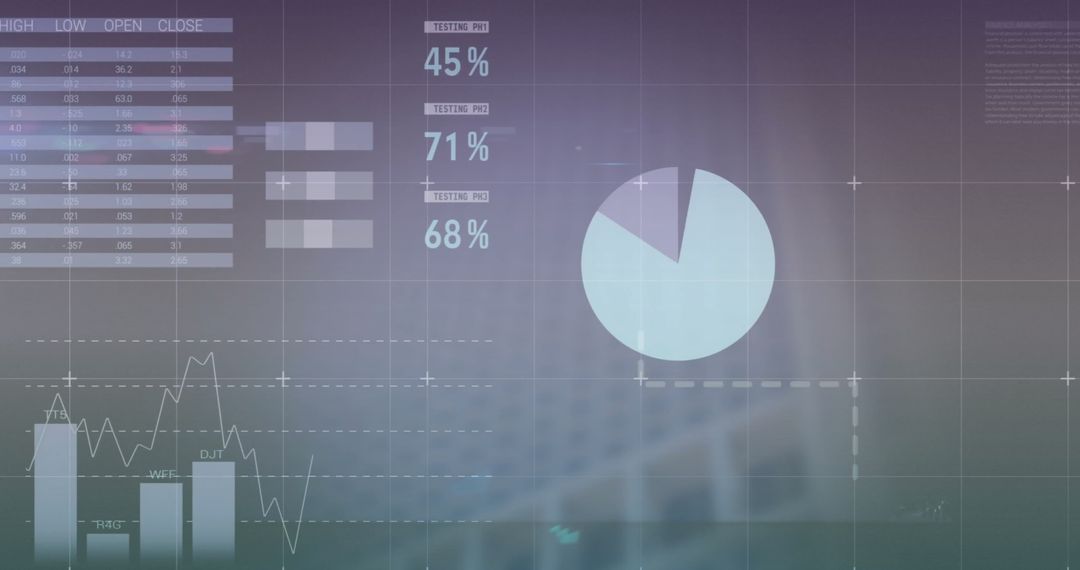
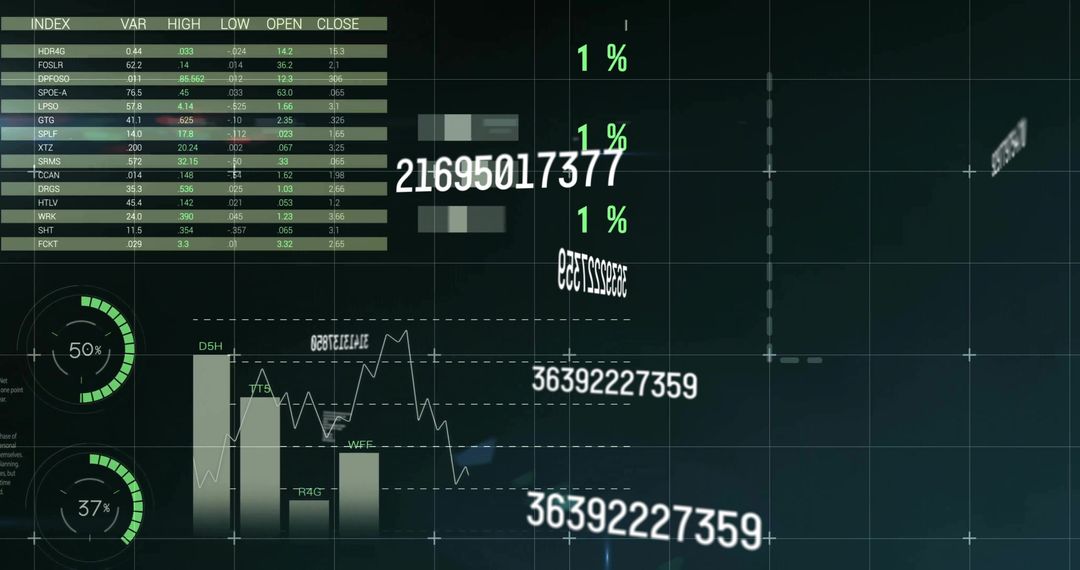
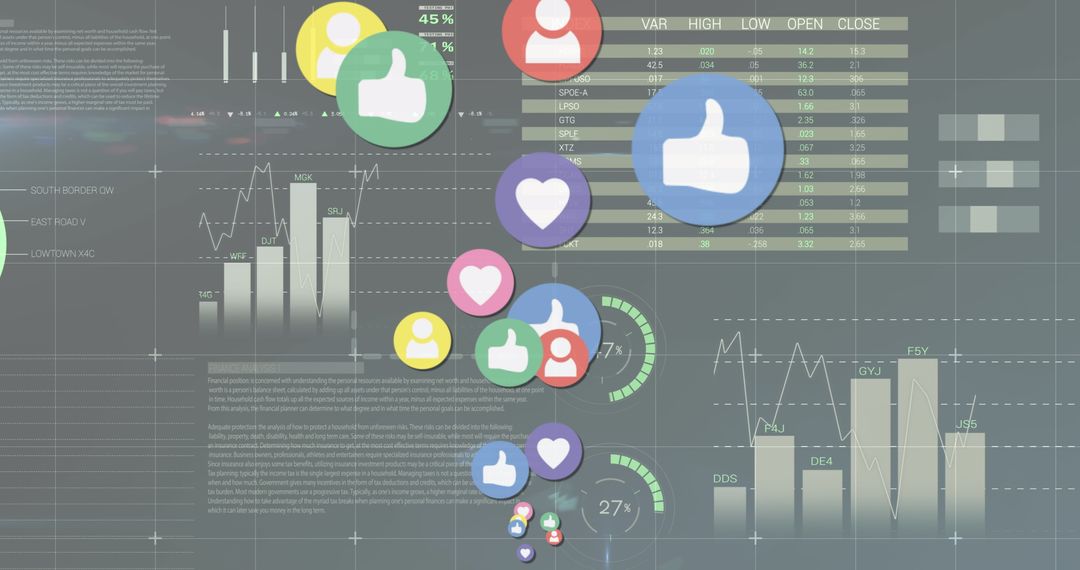
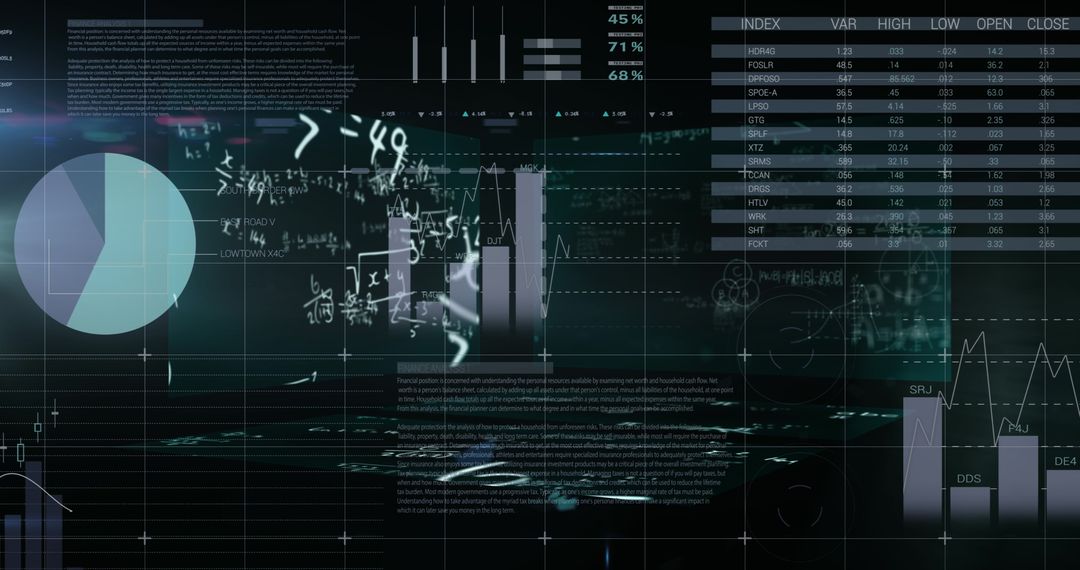
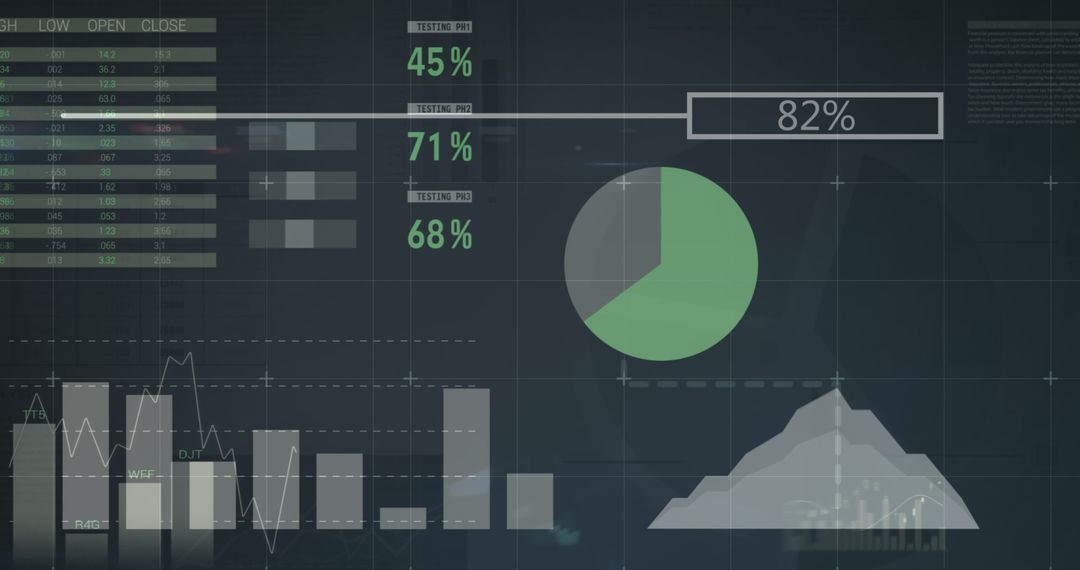
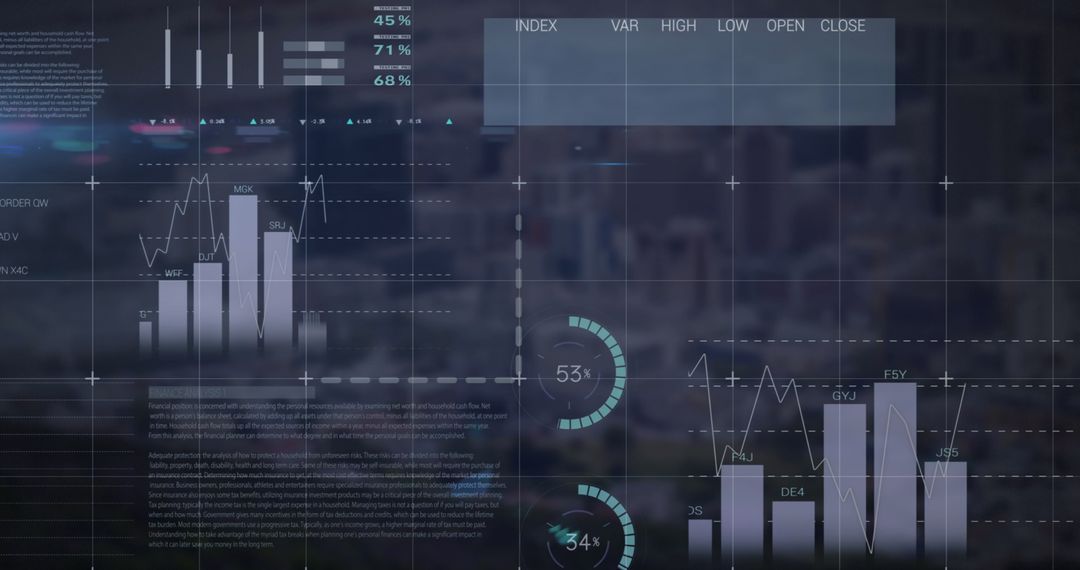
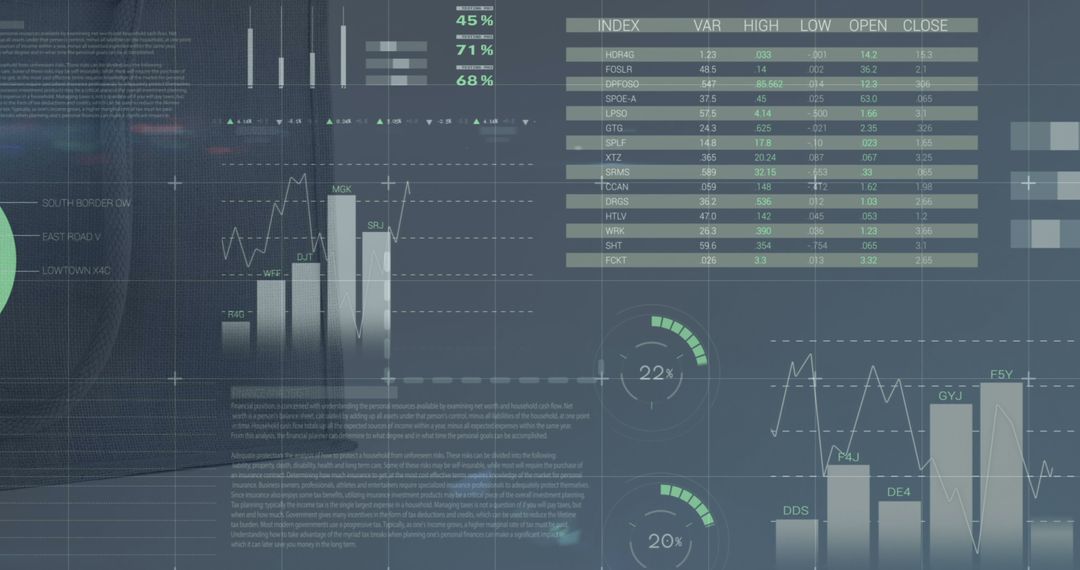
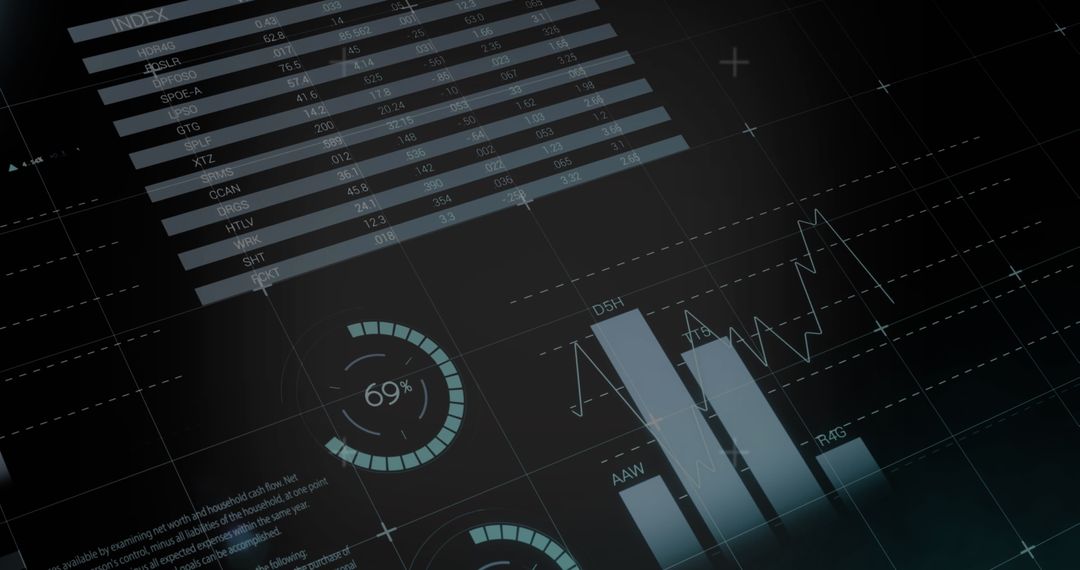
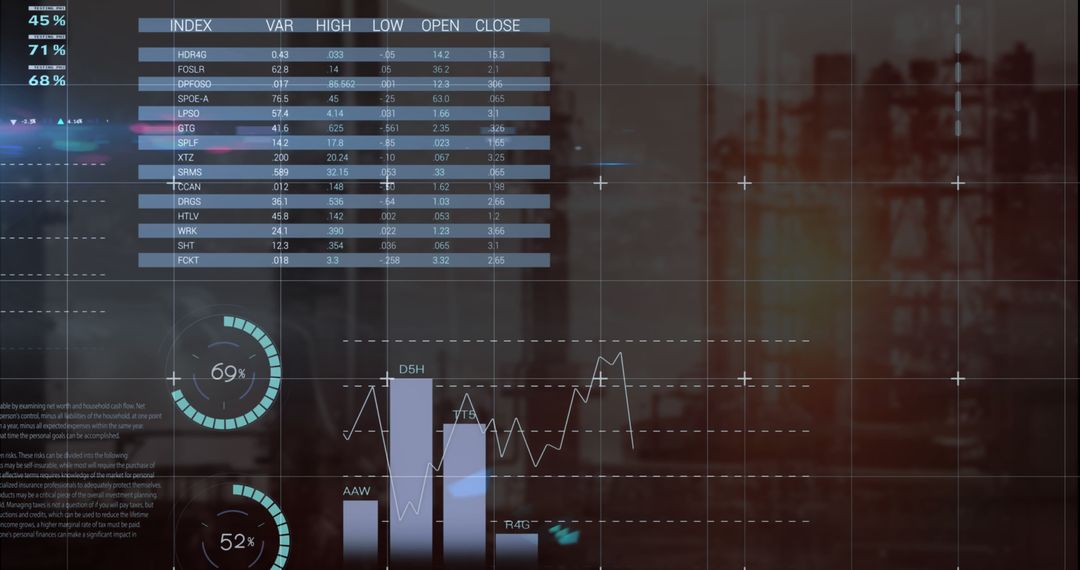
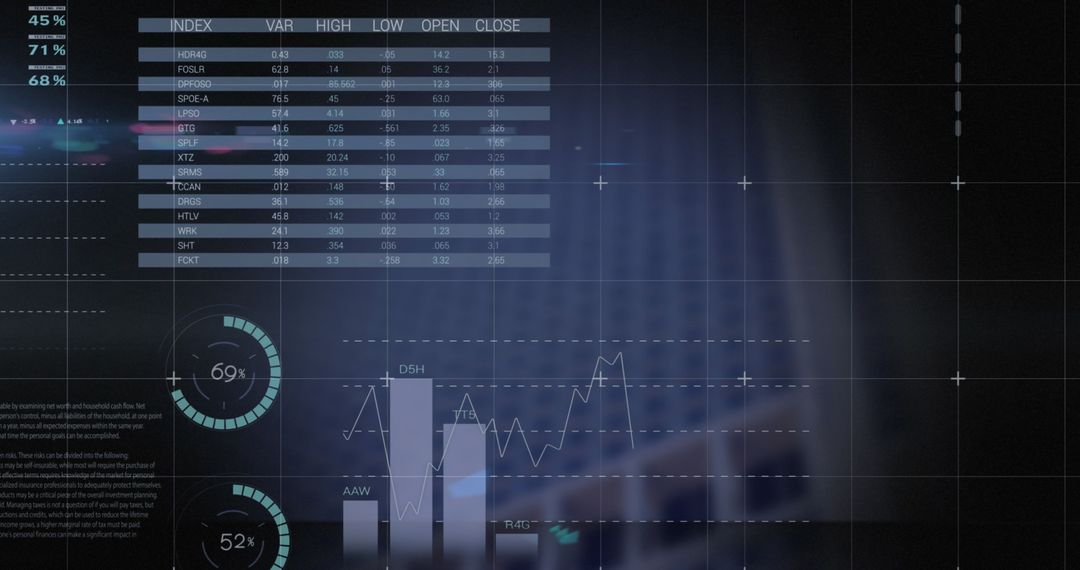
- Digital Financial Data Dashboard with Bar and Line Graphs
Digital Financial Data Dashboard with Bar and Line Graphs Image

Visual representing economic data and business analytics with bar charts and line graphs. Useful for illustrating concepts of global finance, investment monitoring, stock market analysis, and business intelligence reports. Ideal for websites, presentations involving financial analysis and decision-making processes.
Powered by 


2
downloads
downloads
Tags:
More
Credit Photo
If you would like to credit the Photo, here are some ways you can do so
Text Link
photo Link
<span class="text-link">
<span>
<a target="_blank" href=https://pikwizard.com/photo/digital-financial-data-dashboard-with-bar-and-line-graphs/e93f163b4de2bed939fde457f46f7376/>PikWizard</a>
</span>
</span>
<span class="image-link">
<span
style="margin: 0 0 20px 0; display: inline-block; vertical-align: middle; width: 100%;"
>
<a
target="_blank"
href="https://pikwizard.com/photo/digital-financial-data-dashboard-with-bar-and-line-graphs/e93f163b4de2bed939fde457f46f7376/"
style="text-decoration: none; font-size: 10px; margin: 0;"
>
<img src="https://pikwizard.com/pw/medium/e93f163b4de2bed939fde457f46f7376.jpg" style="margin: 0; width: 100%;" alt="" />
<p style="font-size: 12px; margin: 0;">PikWizard</p>
</a>
</span>
</span>
Free (free of charge)
Free for personal and commercial use.
Author: Authentic Images
Similar Free Stock Images
Premium


Premium


Premium


Premium


Premium


Premium


Premium


Premium


Premium


Premium


Premium


Premium


Premium


Premium


Premium


Premium


Premium


Premium


Premium


Premium


Premium


Premium


Premium


Premium